")
")

Advanced Management and Remote Control of Green Areas: New Techniques for Sustainability
Battista P.1, Rapi B.1, Romani M.1, Sabatini F. 1, Cacini S.2, Massa D.2, Mati F.3
1 CNR – Institut for the BioEconomy, Firenze 2 CREA - Council for Agricultural Research and Economics-Vegetable and Ornamental Crops , Pescia (PT) 3 Piante Mati, Pistoia
Designed to provide operational support to designers and managers of green areas in the urban area, in this first version, still to be considered prototype, GARANTES maintains a structure similar to that of geographic systems, capable of managing data from different information sources, to various spatial and temporal levels, integrating them with site-specific, environmental, biological and managerial models (Romani et al., 2012). For an operational use of the system outputs, the data used must be representative of the condition existing within the area of interest and in any case capable of satisfying the information requirements of the indices and models implemented, according to the principles and criteria indicated by the end users based on their needs.
The data arrive at the central GeoDataBase with an hourly or sub-hourly frequency and all the system components are kept up to date with respect to the condition of the different elements (plant status, interventions, treatments, etc.), directly by the user or by consulting the local archives, possibly connected to the system. As for the models and criteria to be used for each site, these are selected in the service setting phase and adapted during the verification phase, which can have a duration ranging from six months to one year, for calibration and possible operational adaptation. This adaptation period is particularly important for users, who are given the opportunity to evaluate the operational usefulness of the information and indications produced by the system, while contributing to its enhancement through their experience. Using common IT applications, in fact, authorized personnel can access the control modules, check the condition of the areas and the elements of their interest, activating or deactivating the components of the support system according to their needs.
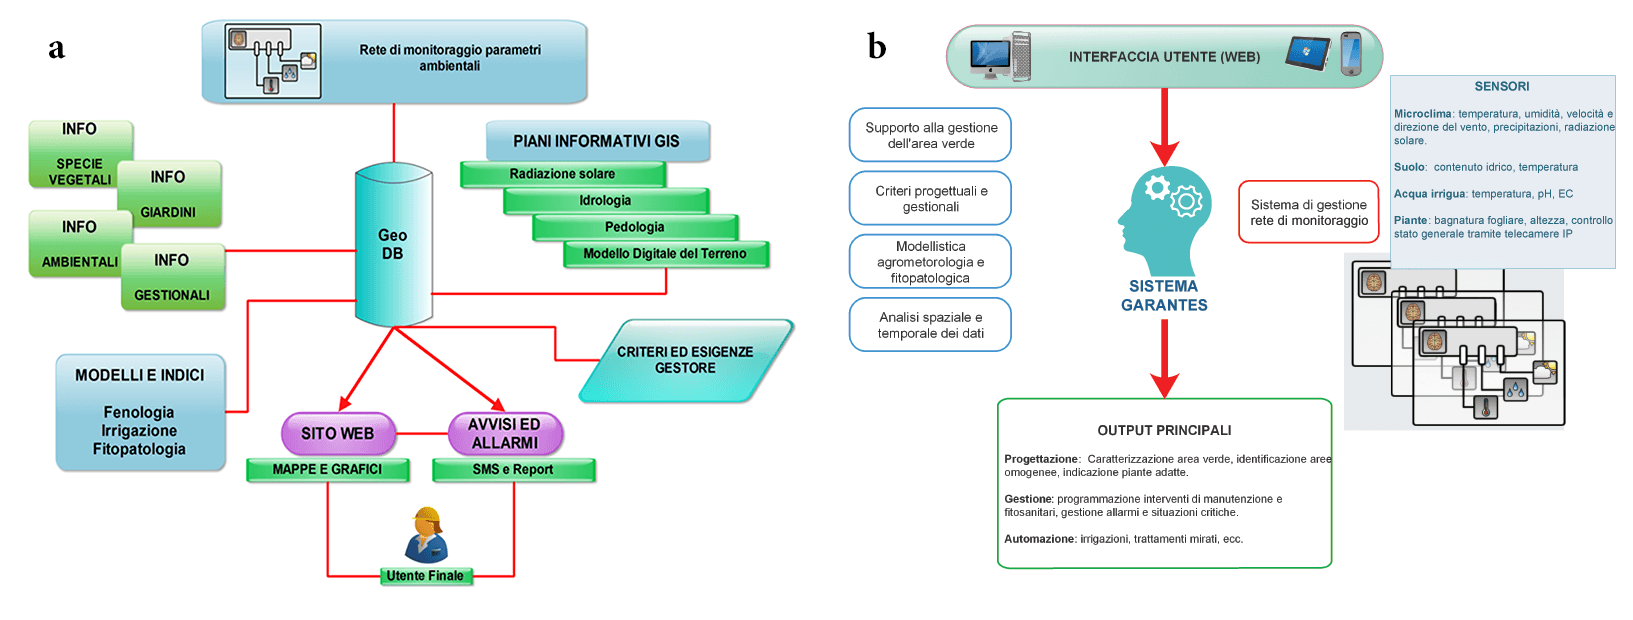
Components of the GARANTES system:
- General data flow;
- Components under the control of the end user.
In any case, in the presence of anomalies in the operation or inconsistencies in the data, the system can send warnings and alarms to the managers and staff in charge of managing the system or site. In this way, even in the absence of a direct control, each site is kept under continuous observation through the analysis of its primary parameters and the display of images acquired by the cameras, if present. To limit the complexity of the system and improve the usability of the information provided, some simplifications can be adopted:
- Limit the number of sectors controlled, identifying homogeneous areas from the managerial and operational point of view.
- Follow the most representative elements (e.g. plants more sensitive to stress factors or diseases, etc.).
- Contextualize the information about the monitored site.
Let's see, in short, a few examples of operations supported by GARANTES system in its current version (GARANTES V.1.0) and information used at the operational level, starting both from the direct observation of the collected data, either by the application of indices and models more advanced, up to the most complex geo-spatial analyzes (Romani et al., 2012; Cacini et al., 2016).
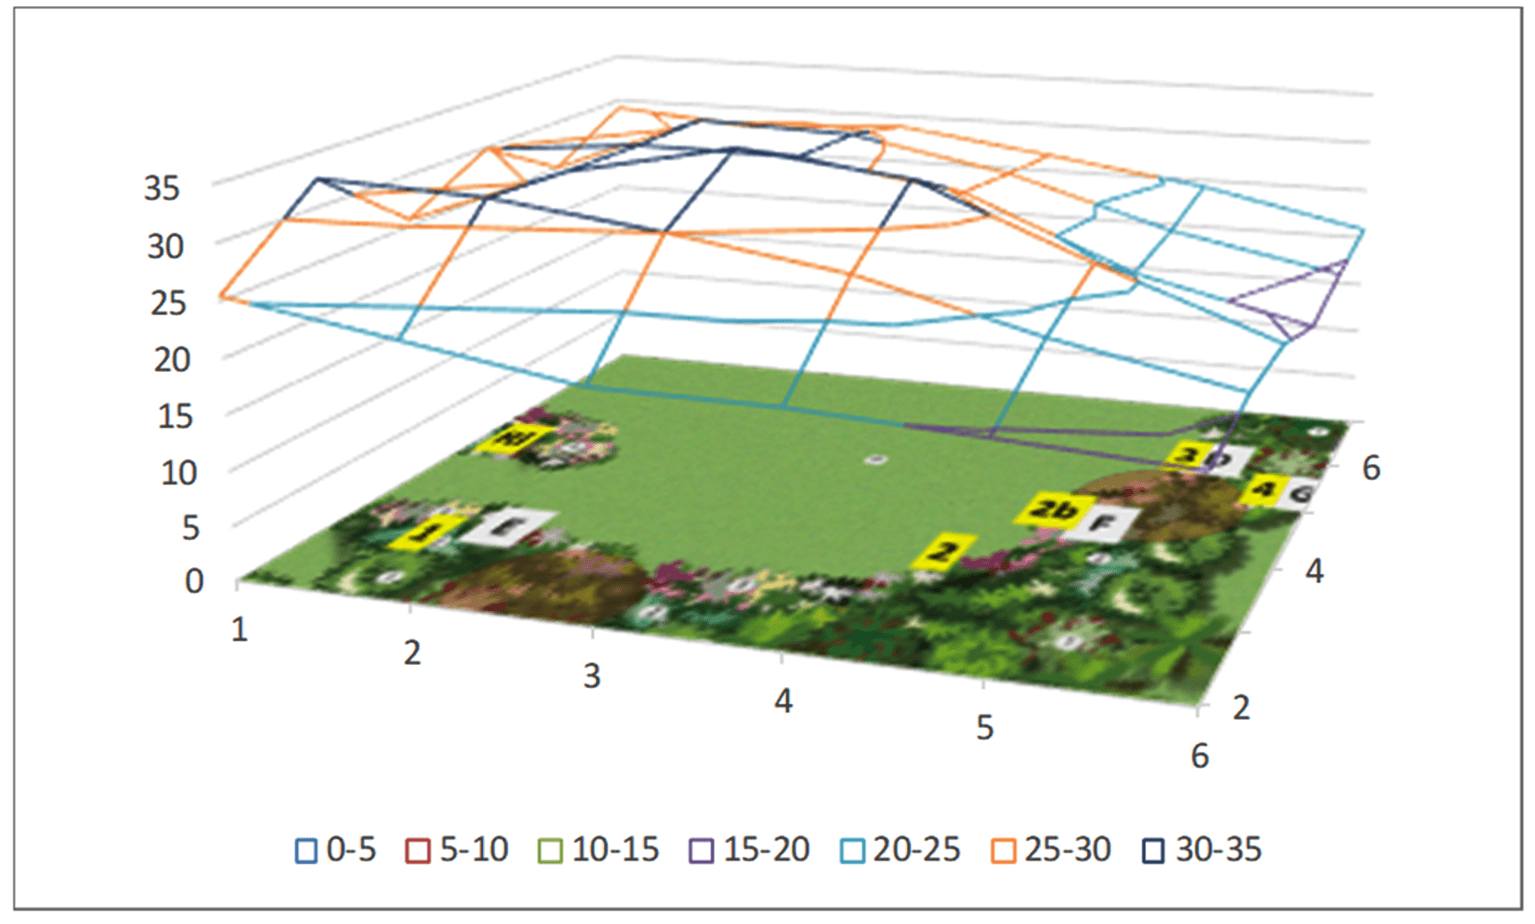
Spatial trend of the air temperature, measured at about 1 m in height inside a garden of the Piante Mati company in Pistoia, on a day in June. The graph highlights the effect of vegetation and shading on temperature: in the central hours, the differences between the various areas can even reach 10 ° C.
Operational reporting
Direct observation of data
Thanks to the sensors and peripherals installed in the experimental sites, it is possible to remotely verify the environmental conditions, observe the evolution of the seasons and evaluate the state of the plants, identifying the conditions of risk or stress induced by adverse weather-climatic events and providing, at the same time, useful information for maintenance personnel, for correct programming of interventions and targeted protection action. The following graphs show some examples of observations deriving from the analysis of the data collected through the monitoring networks installed in the experimental gardens, to plan and regulate maintenance interventions.
a) Analysis of the thermal gradients recorded on a June day inside the garden of the "Piante Mati" company in Pistoia . The differences between the hourly temperature values of the various areas, however significant from a biological point of view, are attributable to various factors, such as the direct action of vegetation and radiation (period June-September 2015: DTmin = 0.8 ° C, DTmedia = 4.1 ° C, DTmax = 10.9 ° C).
b) Analysis of the persistence of humidity values above 90% in May, in a pilot garden located in Forte dei Marmi (Lucca). The humidity is a decisive factor in determining the risk of fungus attack and the fact that some plants have been for 40% of the time in conditions of high humidity, suggests the need for interventions on the foliage or on the air circulation.
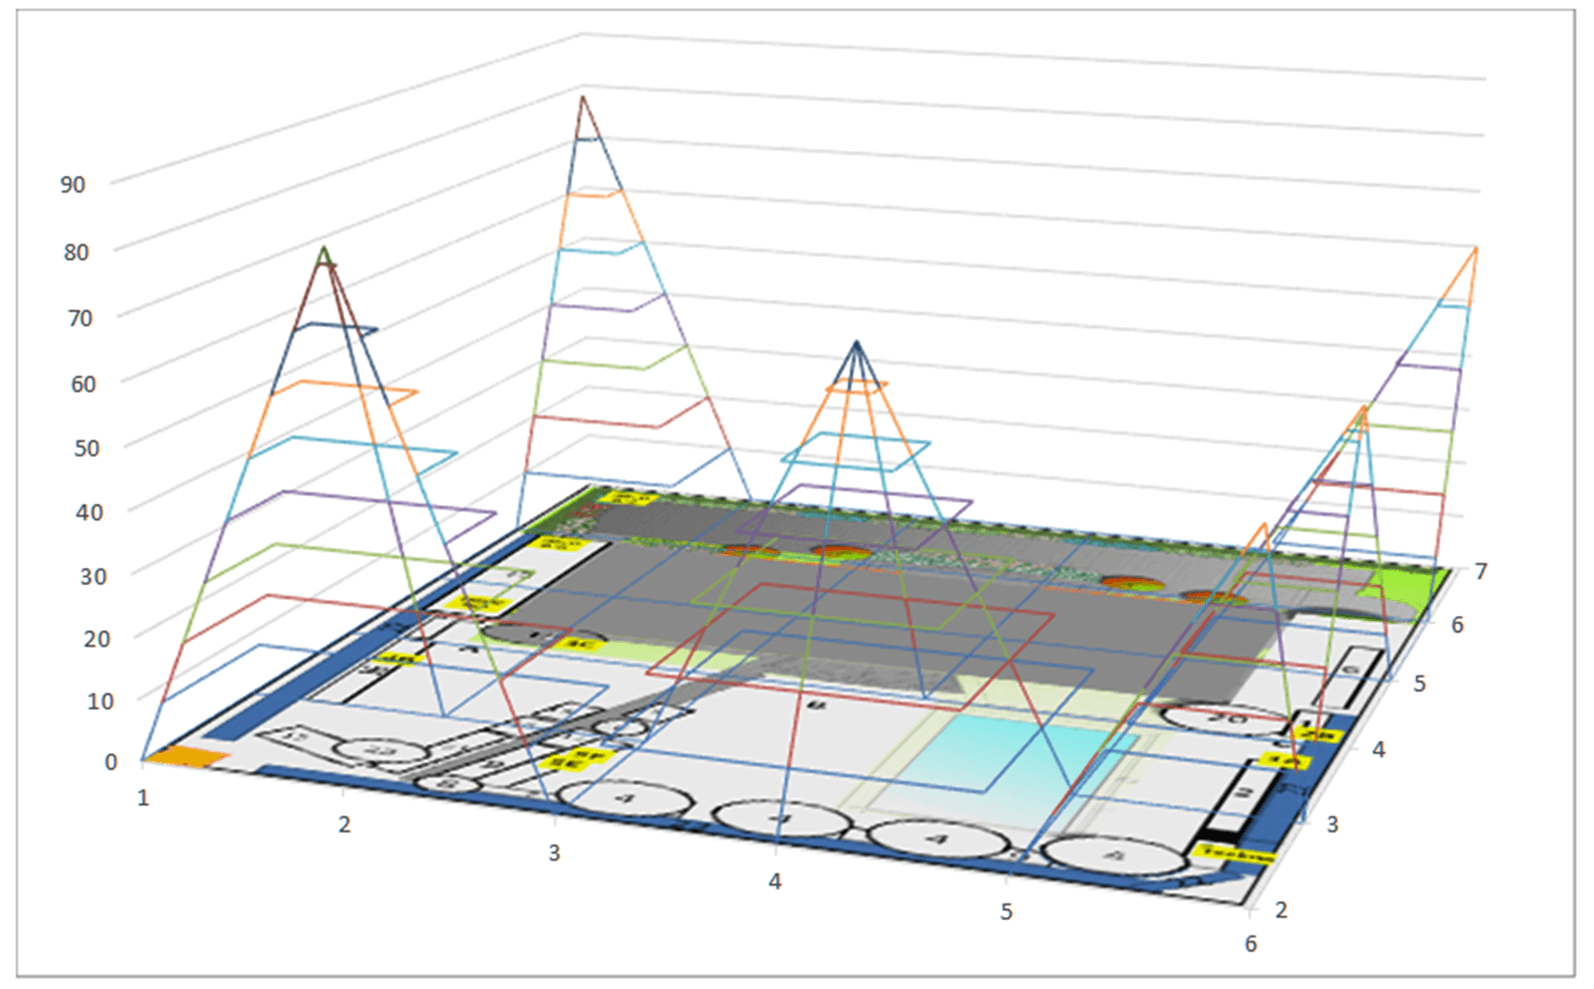
In May, the hours spent by the plants in the flowerbeds in wet conditions greater than 90% are between 25 and 40% of the total.
c) Analysis of the soil moisture trend linked to the characteristics of the detection point. The graph shows the lack of homogeneity in the water availability in three areas of a park, attributable to different edaphic, morphological and management conditions:
- SM1 - Area under a slope, with water stagnation problems, cultivated with rosemary.
- SM2 - Area without effective irrigation, covered by boxwood.
- SM3 - Area with automatic management system, cultivated with hydrangeas.
The analysis of the collected data revealed the need to intervene in the SM1 area, in order to restore a satisfactory drainage condition and in area 2, with manual irrigation, pending structural changes.
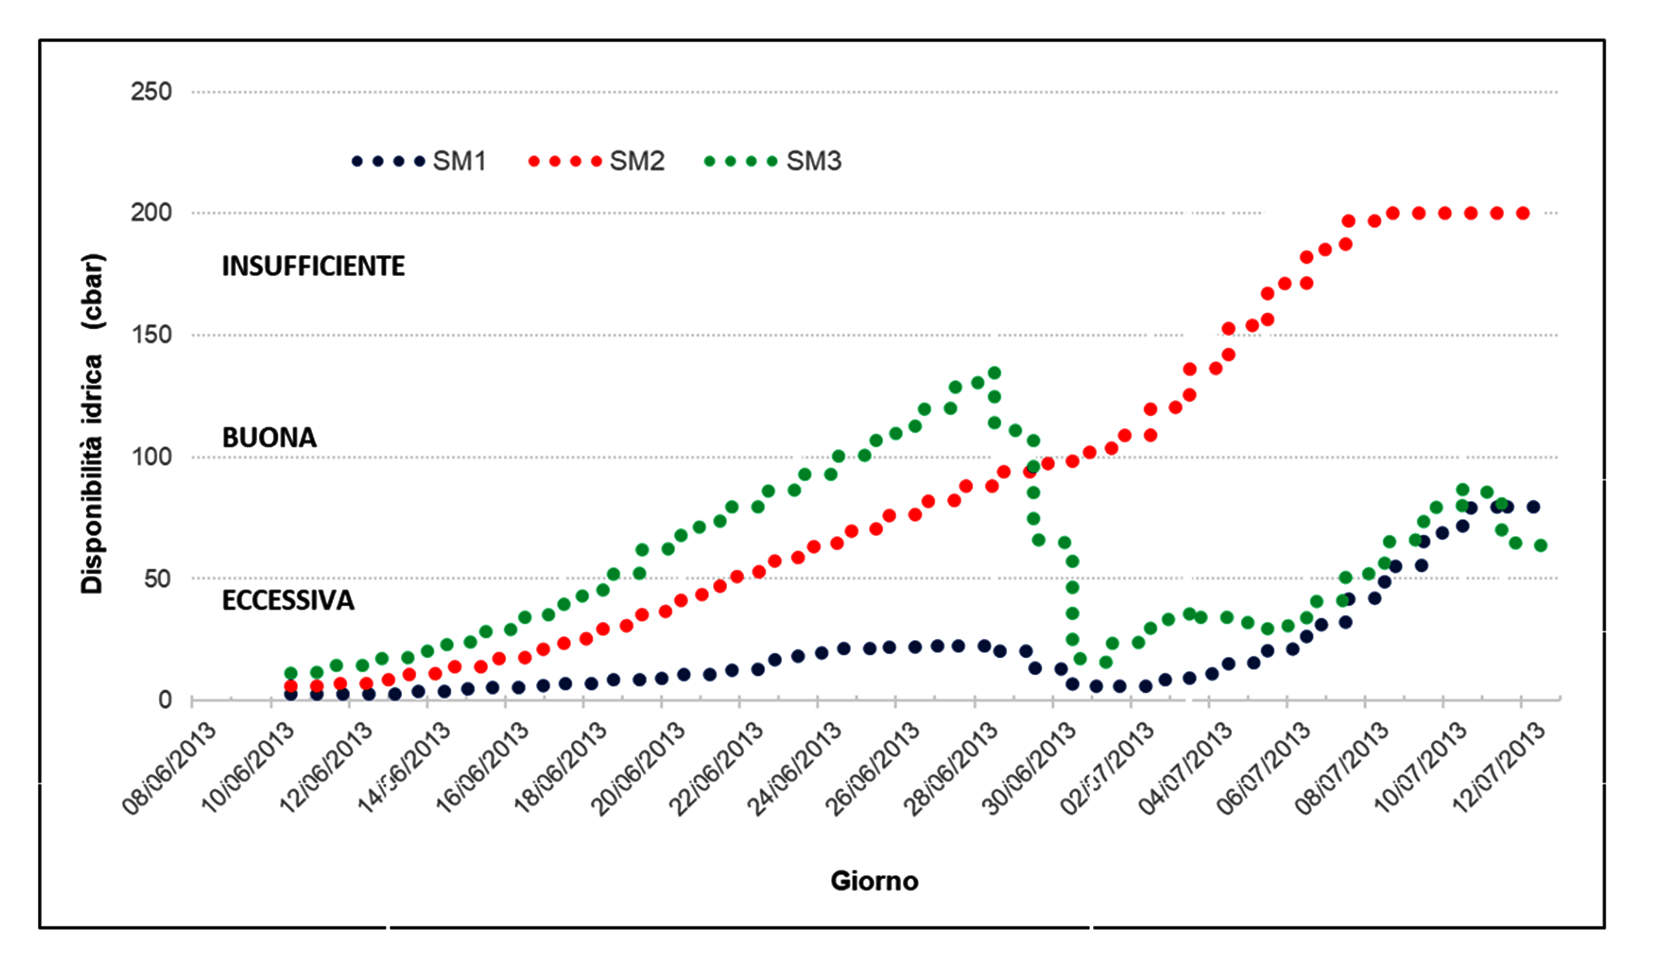
Soil moisture trend measured at three different points on a slope, with management indications: 1) Excessive humidity (SM1); 2) Water scarcity (SM2); 3) Respect of the range (SM3).
During these years, other episodes have highlighted the possibility of identifying the emergence of critical conditions through direct observation of the data collected by the local detection network, on specific parameters. After appropriate checks, this experience is transferred to the system, through the introduction of thresholds or operational criteria. By observing the soil temperature in the first 10 centimeters, for example, controls have been introduced on the growth of the turf grass, on the risk linked to low temperatures and on the appearance of fungal diseases.
Model indications
The models implemented in the GARANTES system allow you to continuously follow some fundamental elements, such as the phenology of plants, water and nutritional consumption and some of the most important biotic and abiotic risks (Bacci et al., 2013). Here are some examples of the benefits that may result from their use at the operational level.
a) Mowing of the turf
The Gelernter and Stowell model (Gelernter et al., 2005) implemented in the GARANTES system, estimates the growth of grass according to the air temperature, acquired on an hourly basis from a reference station.
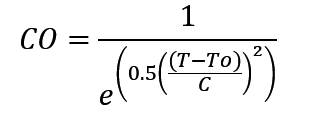
Where
CO - Growth potential (range 0 ÷ 1)
T - Measured temperature (° C)
To - Optimal temperature (e.g. 20 ° C for cool-season)
C - adjusts the change in CO as temperature moves away from To (eg. 5.5-10 for cool-season).
The value obtained can easily be transformed into the height of the grass, multiplying the CO parameter by the hourly rate of growth, expressed in cm, thus making it easier for the user to introduce the intervention thresholds. The indications provided by the model regarding the need or not for an intervention (mowing) are linked to the seasonal trend and do not consider any water stress or nutritional limitations. In order to align the model's estimates with the real conditions, the user, in addition to entering the actual cutting days, can modify the main parameters, such as the maximum daily growth, the optimal temperature range and the criteria for vegetative restart or winter break . From observations conducted on the experimental site of the CREA of Pescia, it appears that the model has a good ability to estimate the daily growth of the turf during the year and to "guide" the interventions based on the seasonal trend.
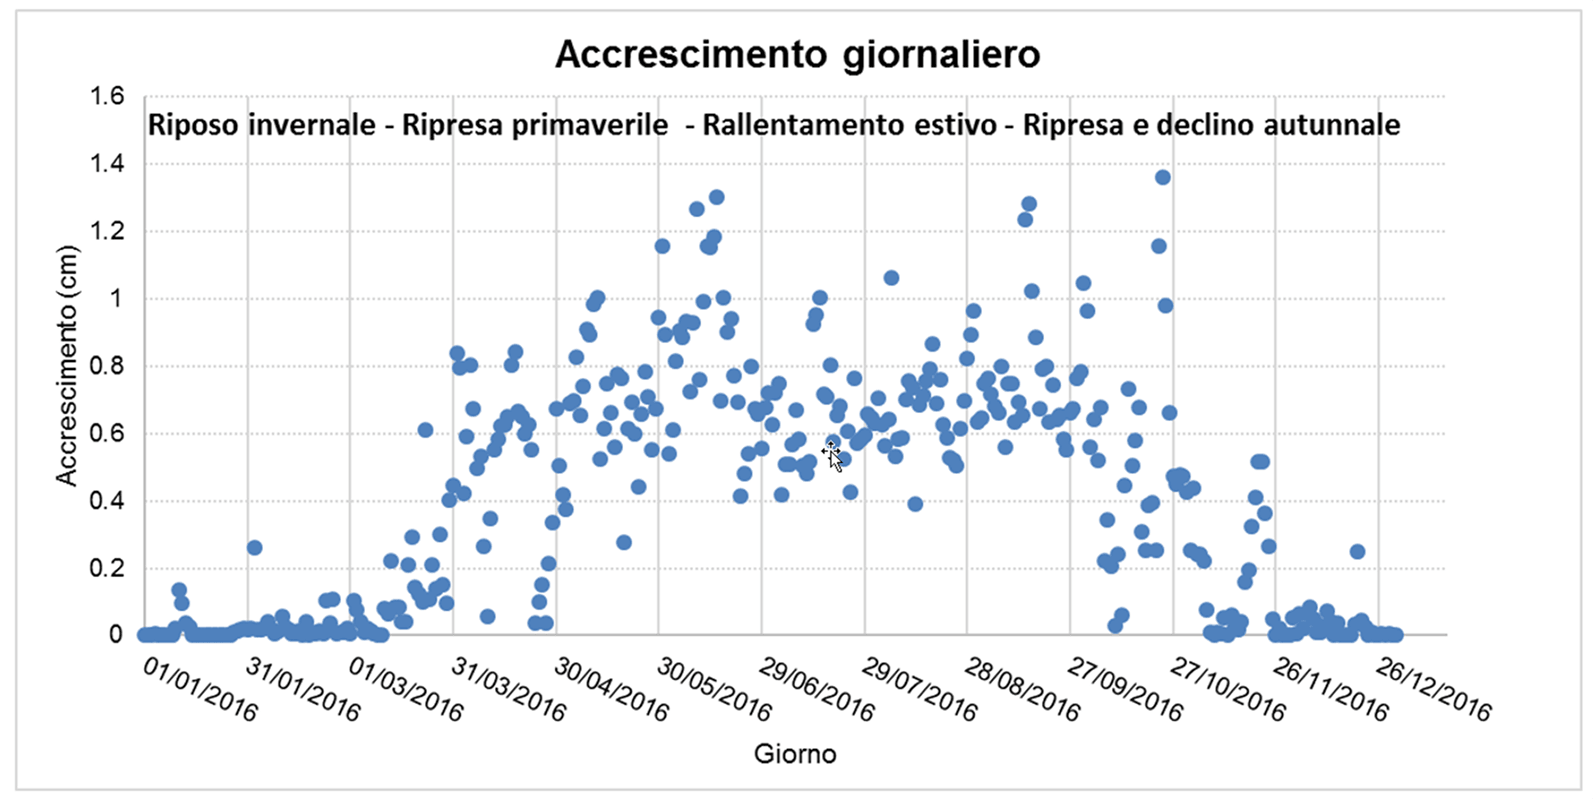
Experimental site of the CREA of Pescia: estimate of the daily growth of the turf during the year 2016.
The indications provided can be evaluated by the end user and adapted to the actual field conditions . The use of fully validated models on the sites of interest can allow targeted programming of the mowing activities according to the characteristics of the lawn, the management criteria, and the weather-climate trend. Furthermore, by using the model in a forecast way, it is possible to estimate the water and nutritional needs, for a more effective scheduling of the interventions.
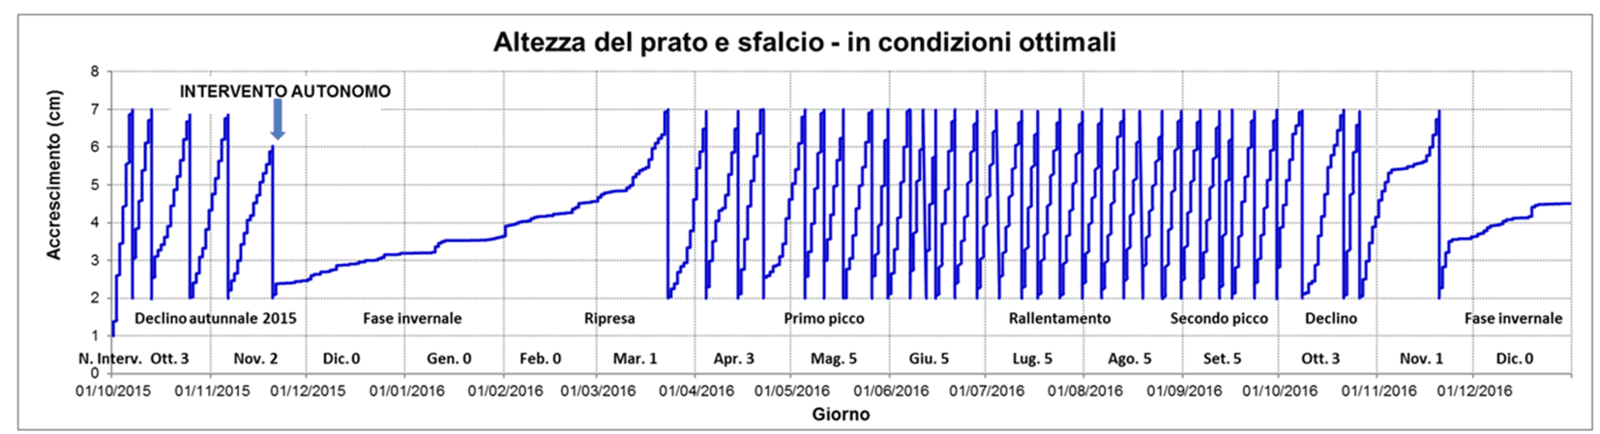
Interventions suggested by the development model, to keep the height of the turf below the predetermined threshold (7 cm) in the period from 1 October 2015 to 31 December 2016.
b) Plant protection
Direct observation by operators often does not allow to identify the moment in which the conditions levels are created for the appearance of a specific agent or a significant increase in risk, beyond safety. For this reason we resort to procedures and models that take into account weather and environmental trend to define the degree of risk and the need to take action, according to the principles of Integrated Pest Management (IPM), made mandatory in Italy from Legislative Decree 150/2012 and the related National Implementation Plan and which consist of "careful consideration of the control techniques available and the appropriate integration with pathogen control measures, maintaining treatments and interventions at sustainable economic and environmental levels". These methodologies are born, therefore, from real needs and need of a continuous comparison with the operators of the sector, to be updated with respect to the procedures, techniques and practices of prevention and fight adopted.
The models used to give operational indications on the risk of the development of insects, fungi and bacteria are based on common principles, validated over time in different areas and confirmed by numerous experiences. These include the thermal thresholds and summations, often combined with other environmental factors (humidity, rain, etc.) and management criteria (treatments, interventions, etc.).
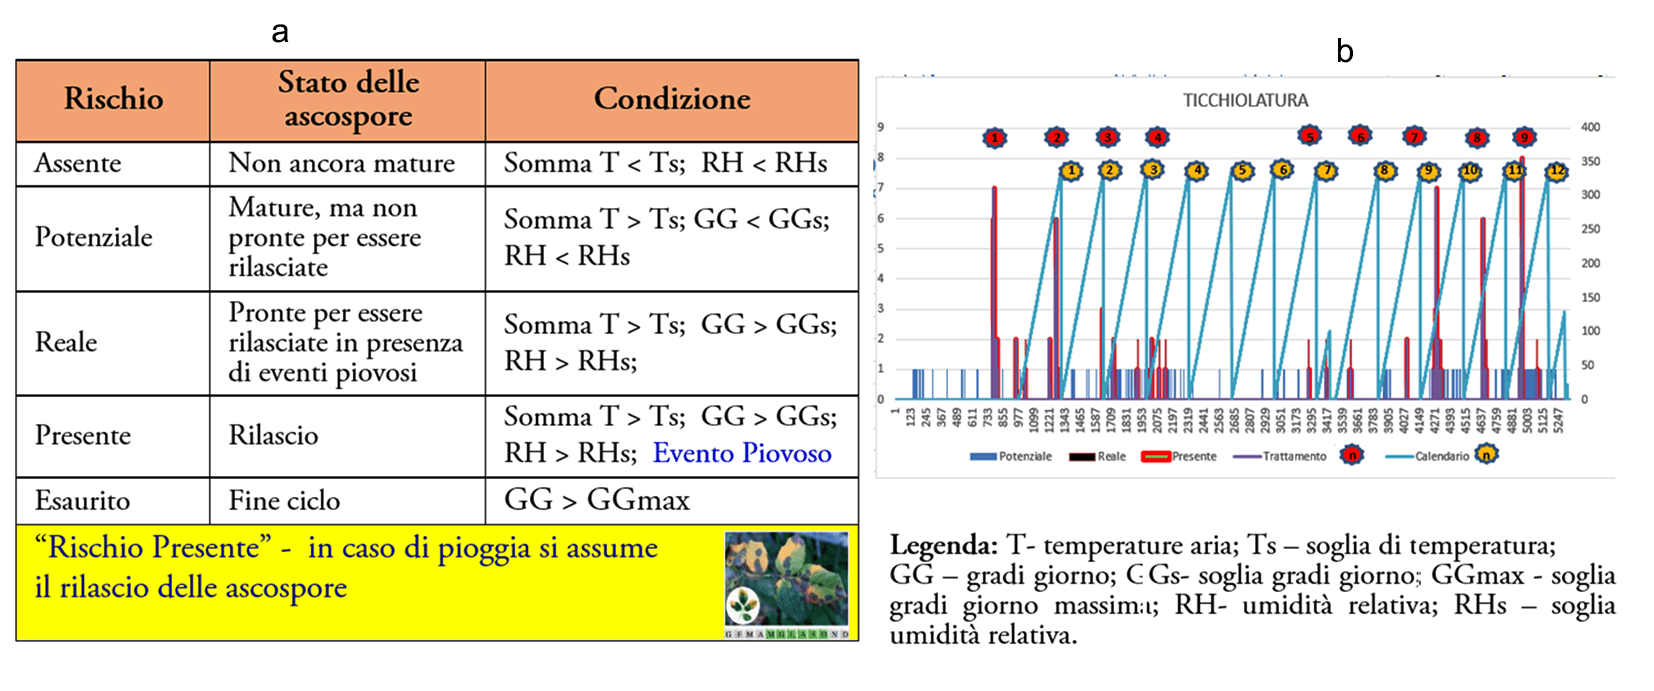
- Criteria and thresholds used to define the risk of scab on rosaceae;
- Summary chart for 2016 of calendar interventions (yellow star) and those suggested by the model (red star), with indication of periods of potential and real risk (Pescia pilot site).
The importance of tools of this kind is evident when the information produced can allow to reduce the number of treatments compared to the operations carried out on the calendar. Some fungal diseases, such as scab for example, may require weekly (or biweekly) treatments, while using models that take into account the effectiveness of the products and seasonal trends, interventions can be significantly reduced, maintaining a high degree of protection. The picture above (letter b) shows the risk indications provided by the simplified model A-SCRAB (Giosuè et al., 2000; Rossi et al., 2001), for the pilot site of Pescia, which highlight the possibility of avoiding some interventions (9 vs 12), especially in the hottest period (July-August: 1 vs 3). Furthermore, due to the continuation of favorable weather conditions for fungal development, some treatments may also be required in periods other than those scheduled (April: 1 vs 0).
Similar considerations can also be made for models based on thermal summations, such as those used for most insects. For the risk assessment, the system uses different thermal summation calculation procedures (Wilson et al., 1983; Zalom et al., 1983). In simpler systems, as for thrips, the prediction of reaching the adult phase is made using three thresholds (Carpino, 2002):
- Lower thermal threshold, TL;
- iUpper thermal threshold, TU;
- Thermal threshold (thermal summation) of appearance, ° Dm.
The model implemented is based on the "single sine" method, with TL and TU values equal to 10 ° C and 30 ° C respectively and performs the calculation of day degrees starting from January 1 (picture below letter a). End users can interact with the model, changing the threshold values and introducing the date of treatments. The picture below,letter b, shows the expected development on three experimental sites, with the restart of insect growth, after a short latency period (20 days). At site 3, with higher temperature values, the model predicted an early generation, suggesting more treatment than the others, towards the end of May.
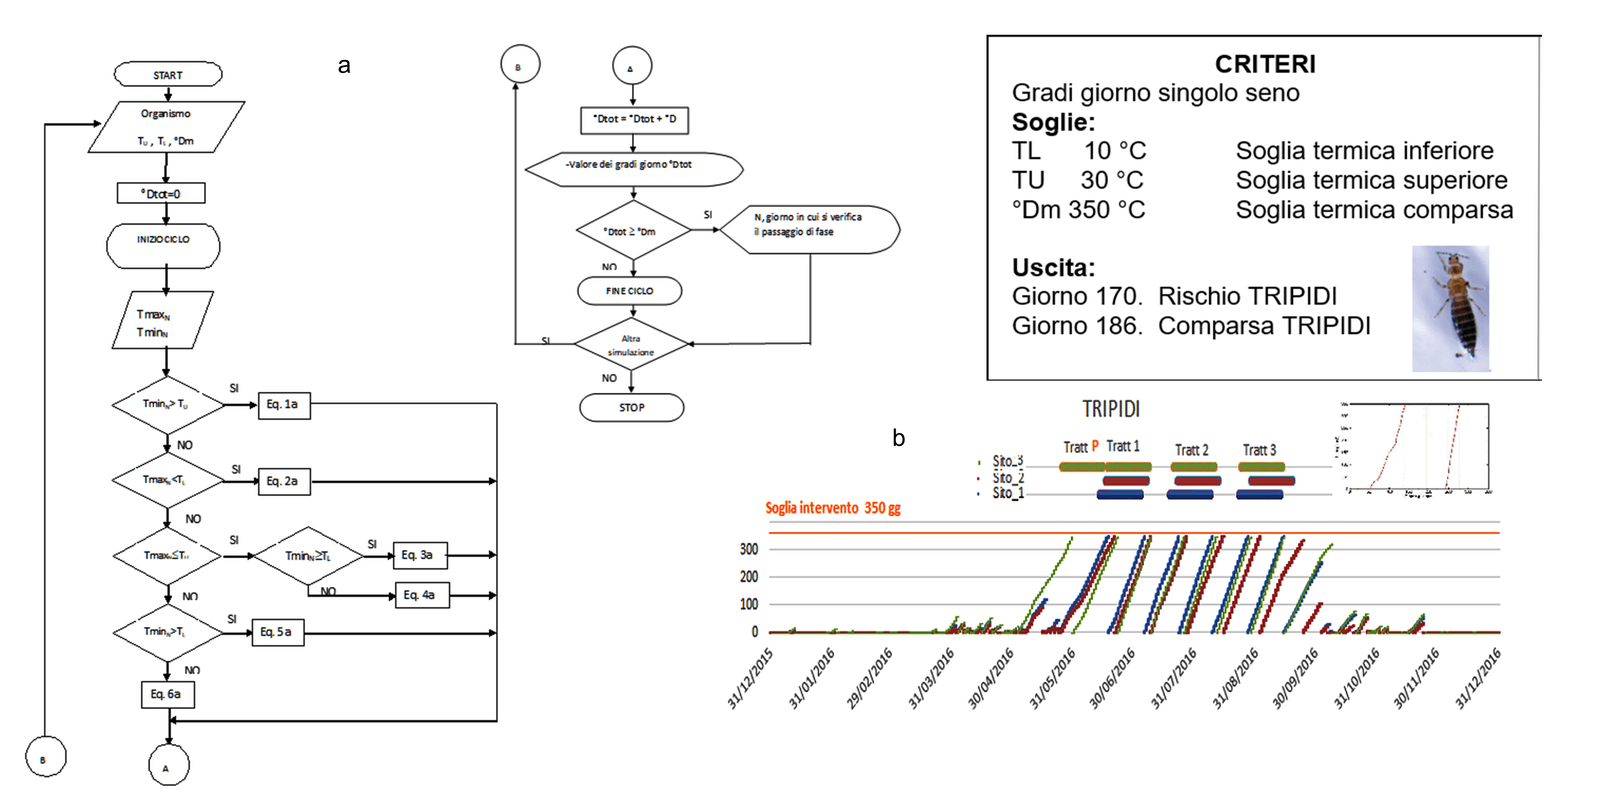
Single sine model: estimates for the appearance of adults and allows the programming of interventions based on the risk of appearance: a) flow chart; b) example
c) Irrigation management
In the experimental site located at the CREA of Pescia, in the period 2011-2016 some significant differences were observed between the two types of garden management, traditional and GARANTES. In particular, the management of the irrigation system of the various sectors through the GARANTES control unit has allowed water savings of 20 to 40% depending on the meteorological trend, compared to the garden managed by timer, without damage or reduction in development being observed some plants.
The figures below compare the cumulative water consumption in the period 25 / 05-03 / 11/2016 of the Plots "Siepi"(Hedges) and "Prato" (Turf) of the two gardens, managed respectively by GARANTES and timer, the latter controlled according to the values ETE (Effective EvapoTranspiration) averages and expected rainfall for the same period based on historical weather data. For the “Siepi” Plot, the final values of irrigation consumption obtained with the two systems were almost equal, but with a clearly different temporal distribution. The one managed by GARANTES (Plot “Siepi_G”) follows the trend of the hydro-climatic balance (BIC = Precipitation (Pe) - Potential Evapotranspiration (PET)), so much so that soil moisture measurements, even if they are punctual, manage to represent this area. In the last month due to the heavy rains (about 144 mm), the soil is saturated, so the GARANTES control unit drastically reduces irrigation. This is highlighted in figure below letter b where the changed value of the hydroclimatic balance is considered, obtained as the difference between the effective rainfall, Pe, calculated with the Chaptal method and the potential evapotranspiration, PET, calculated using the CIMIS equation.
For the Plot managed by the timer (Plot “Siepi_T”), due to the rains there is an overestimation of water consumption during the initial phase, followed by a period (20 June-20 July 2016) in which these are underestimated. Subsequently, the water management is optimal until 15 September 2016, after which the timer seems to give an excessive amount of water.
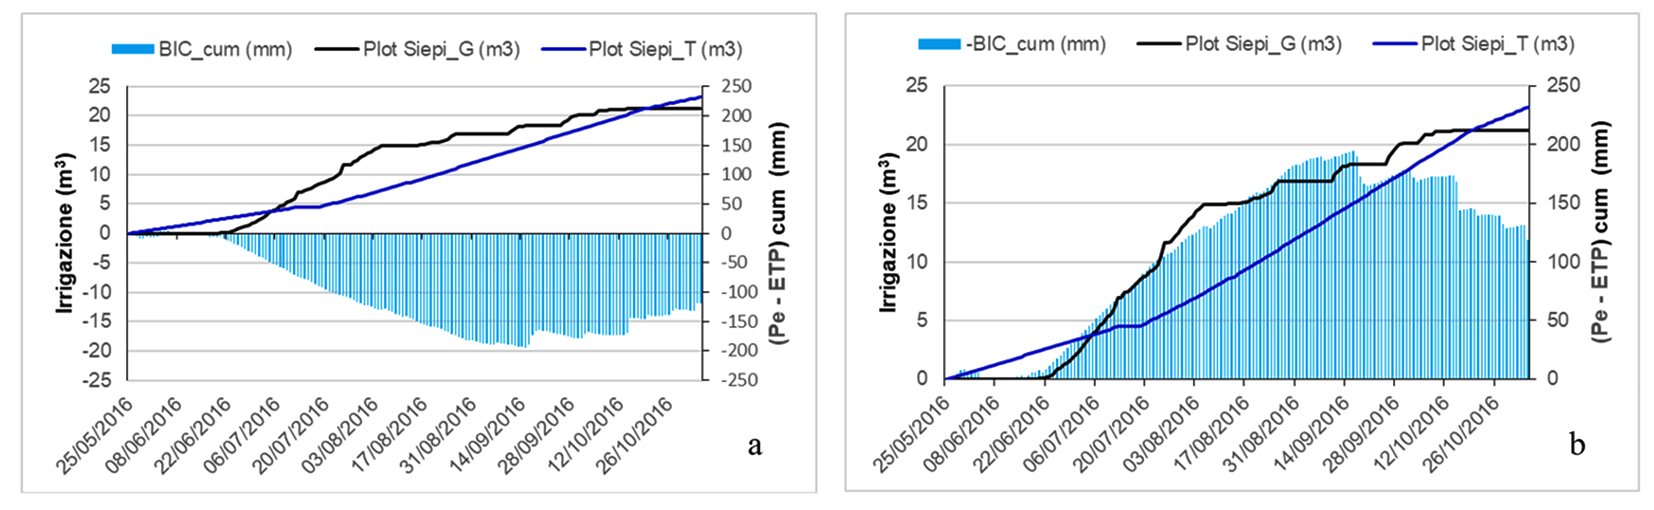
Comparison between the trends in water consumption in the period 25 / 05-03 / 11/2016 of the plot "Siepi" managed respectively by the GARANTES (Plot Siepi_G) and Timer (Plot Siepi_T) units
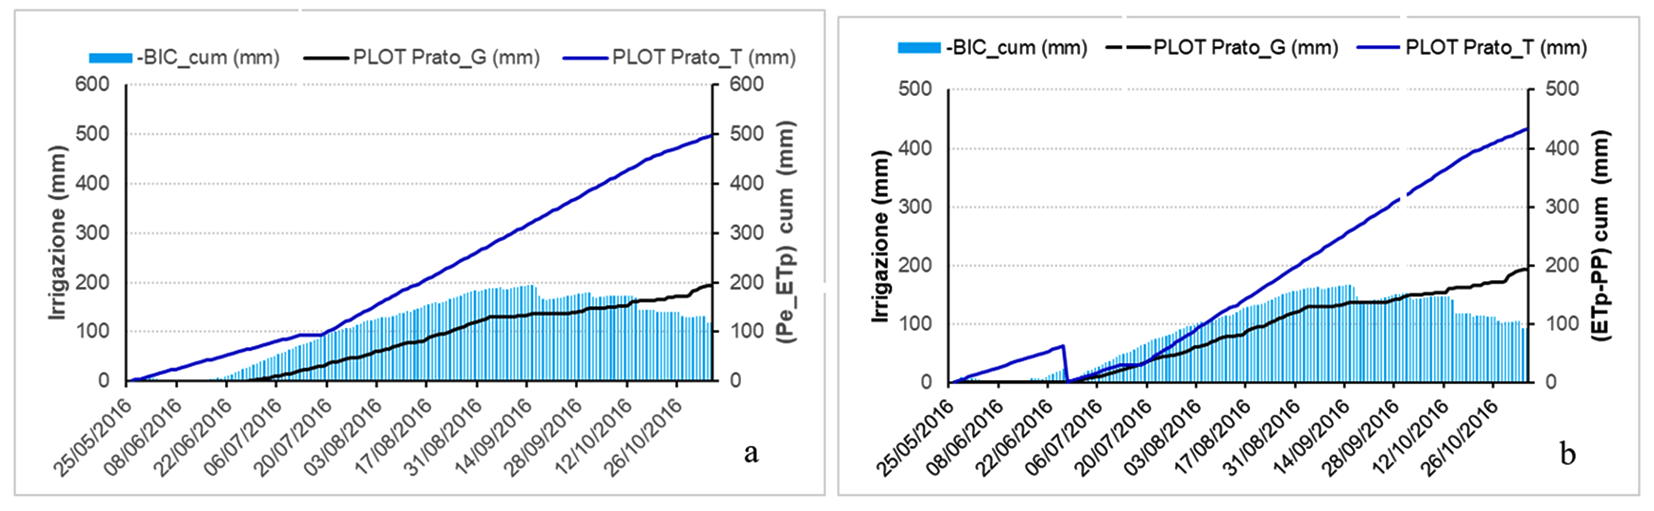
Comparison between the water consumption trends of the "Prato" plots, managed through the GARANTES (Plot Prato_G) and Timer (Plot Prato_T) units, in the period 25 / 05-03 / 11/2016
The analysis of the consumptions relating to the "Prato" Plots highlights a different behavior of the two control systems (Figure above letter a): an overall overestimation of the consumption for the Timer (Plot "Prato_T") and an initial underestimation for the GARANTES management (Plot "Prato_G" ). In fact, it can be noted that the management of the "Prato_G" plot presents problems in the first month (irrigation lower than the BIC), while in the subsequent period it seems to follow the BIC trend almost optimally (Figure above letter b). A diametrically opposite behavior is obtained for the "Prato" Plot managed by Timer, in which, although the average consumption forecast for the period was considered, an excess of water was given in the second period.
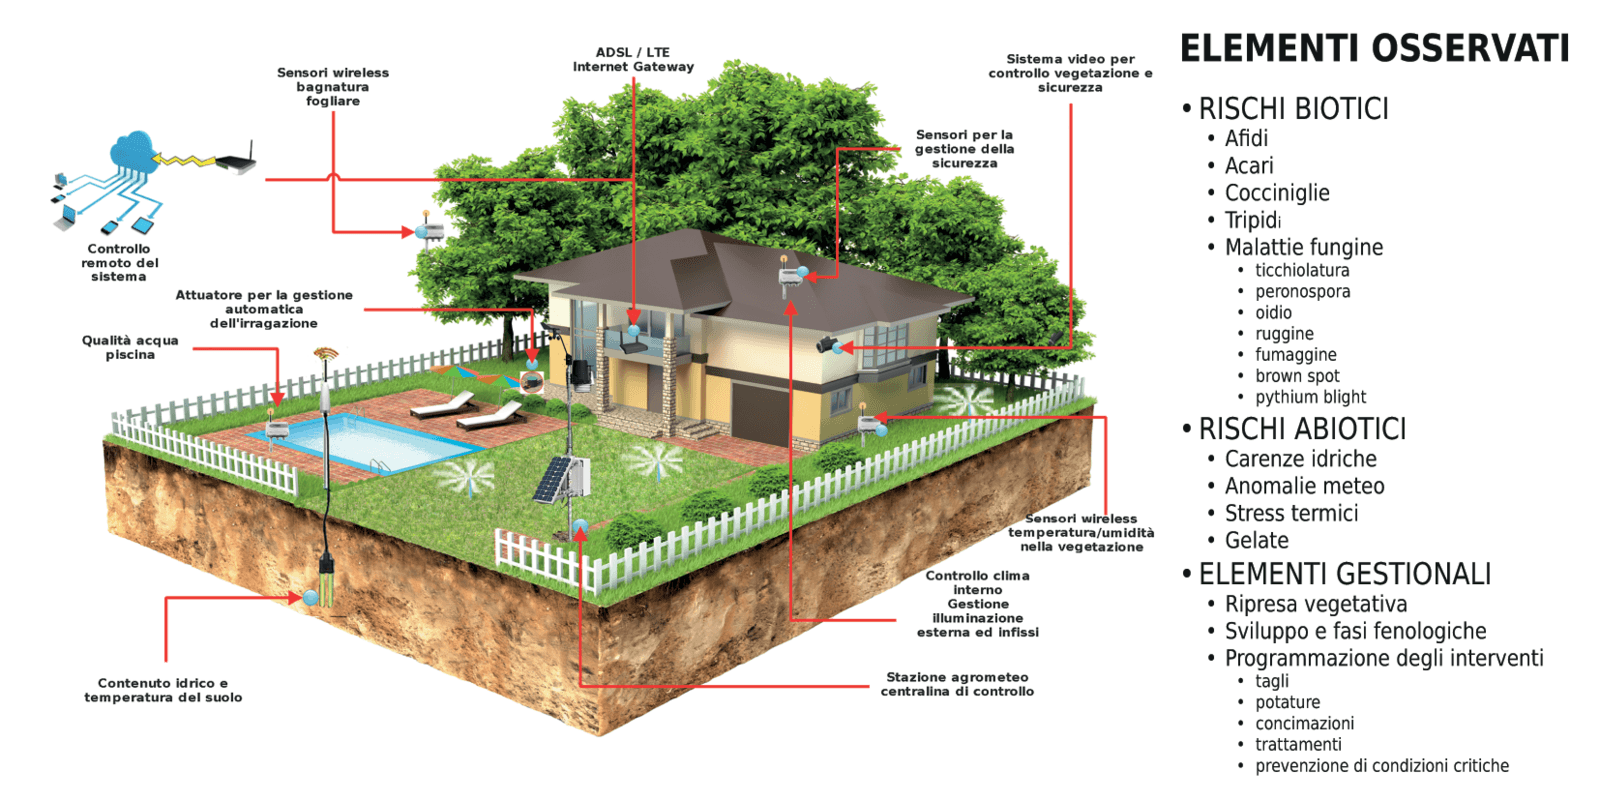
Management elements of green areas
The efficient management of green areas and large gardens or with highly diverse vegetation is a complex task, which requires in-depth knowledge on a variety of aspects. To meet operational needs, GARANTES uses various tools, integrated on a geographical basis during the analysis phase. In general, this type of analysis requires careful preparation work, both for the characterization of the areas and plant elements, and for the development of procedures and criteria, which must respond to real operational needs. "Ad hoc" solutions are therefore researched and adopted to respond to specific local problems, also using specific subsystems and sensors.
The new paradigm of information technology is represented by the increasing autonomy of sensor nodes and control subsystems, which at local level are enabled to perform multiple functions and communicate with the interconnected systems (IoT, IoE, M2M, etc.). In the environmental field and, specifically, for the support of the management activities of elements and resources of the territory, the potential of these systems is enormous and ranges from the more properly home automation, equipment control, to technical-agronomic and specialist activities.
The continuous evolution of the sensor and computational components represents an enormous application potential, which opens to ever new solutions with a growing degree of autonomy. The application cases are now numerous also on a commercial level, with control systems based on communication between machines and between machines and infrastructures. In these systems, however, the large number of connected sensors requires a shift of the analysis level towards the sensor node and, at the same time, an increase in the control capacity at the level of the central analysis system, called to perform typical supervisory functions or tutoring.
The level of integration of devices makes possible a high concentration of the sensors and the acquisition of a huge number of information, the use of which is in part still to be examined and evaluated. Therefore, the task of analysts and model makers remains central in the research and development of increasingly efficient and sustainable solutions to be transferred also locally, thanks to the firmware, on highly integrated and compact sensor platforms.
Pending these natural evolutions, already within the project, the sensor data are acquired by a local unit (a programmable data logger), capable of carrying out some preliminary processing based on the model indications and criteria defined by the experts, and subsequently they are transferred to the remote control center, which carries out complementary and supplementary analyzes. Within the central database, data and information are organized and related to each other, to offer updated references for technical-specialist assessments. For example, about the phytosanitary aspects, each plant can be connected to its own pathogens and pests, also through information provided by the user and relating to the manifestations of damage or stress.
Given that the green area must be seen as a whole, as an organism in continuous evolution and subject to changes, among the most important functions of the central system is the forecasting one, capable of assessing what the consequences of a certain technical-operational choice. A function that requires the combination of all the available environmental and management data with the basic information present in the system database.
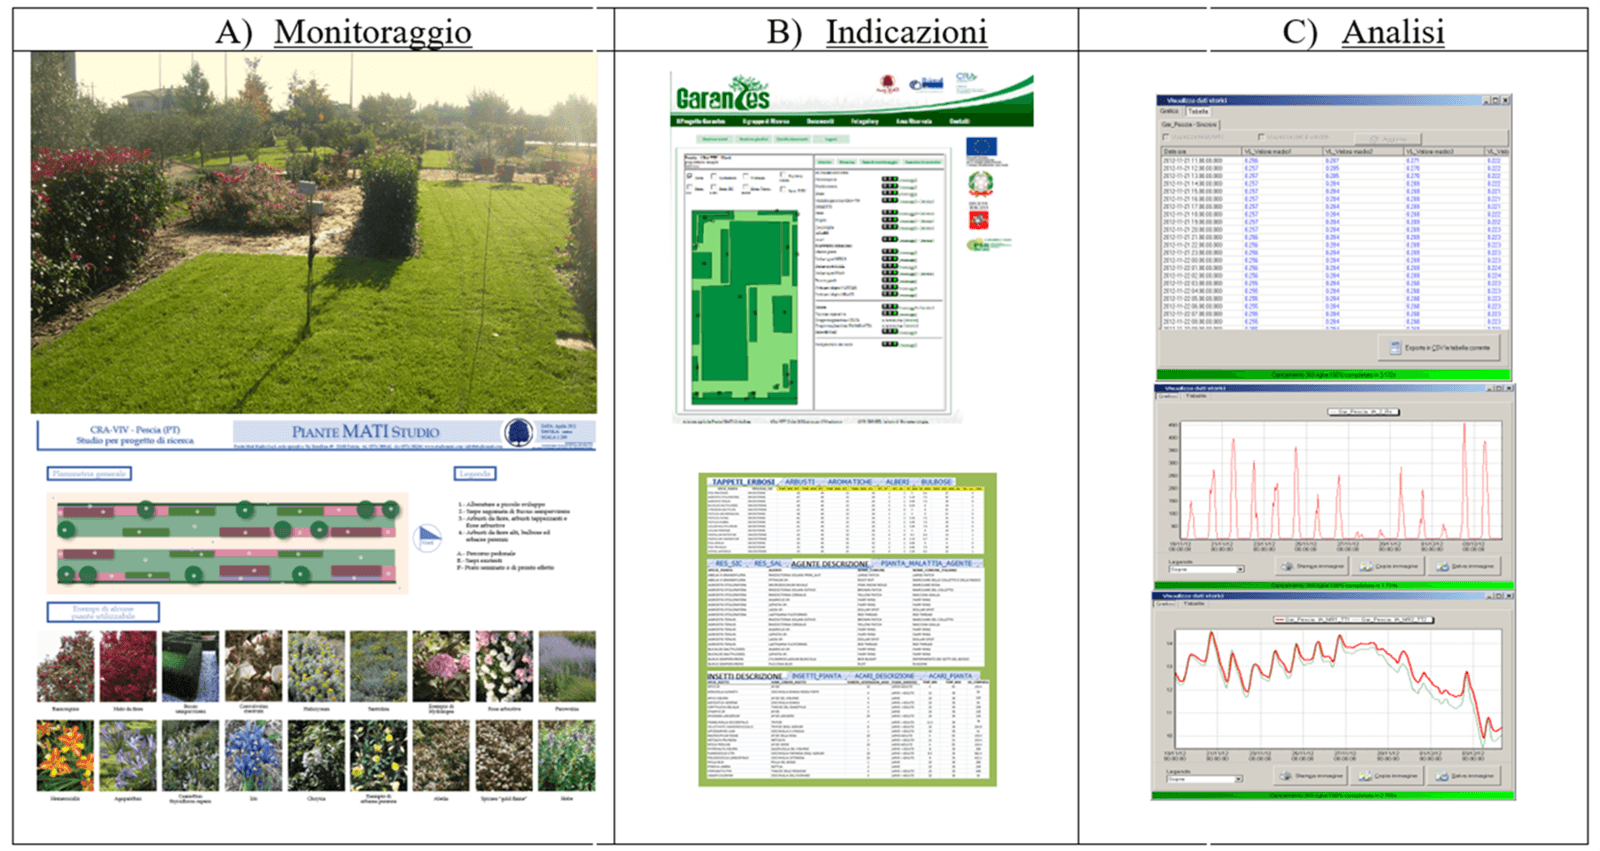
Experimental area of Pescia (CREA-OF), and visualization of some characterizing elements:
- Monitoring: definition of homogeneous areas and relative vegetation;
- Information: display of the active elements and the risk level reached;
- Analysis: example of system screens (tables and parameter trends).
The originality of the GARANTES prototype therefore lies mainly in the choice of the development procedures for the integration of the components, in the ability to remotely manage areas with different degrees of complexity and to transmit forecast / programmatic information on phytosanitary risks or on the need for intervention by operators
Reference
- Bacci L., Battista P., Rapi. B., R omani M. (2012). Garantes Project - Advanced management and remote control of green areas: new techniques for the sustainability. GREEN WEEK 2012, Brussels (Belgium), 23 May 2012.
- Bacci L., Battista P., Fiorillo E., Rapi B., Rocchi L., Romani M., Sabatini F., Zantonetti S., Mati F., Moro M., Tredici F., Cacini S., Pacifici S., Burchi G. (2013). GARANTES - Gestione Avanzata e controllo Remoto di Aree verdi: Nuove TEcniche per la Sostenibilità: Relazione tecnico- scientifica Coordinata. Pistoia, 12 dicembre 2013, pag. 40.
- Barrell J. (2015). According to Barrell … Urban trees let down by policy failures. HorticultureWeek.
- Bell S., Hamilton V., Montarzino A., Rothnie H., Travlou P., Alves S. (2008). Greenspace and quality of life: A critical literature review (Greenspace Scotland Research Report). Stirling.
- Britt C., Johnston M. (2008). Trees in Towns II – A new survey of urban trees in England and their condition and management. London: Department for Communities and Local Government.
- Cacini S., Battista P., Massa D., Rapi B., Romani M., Sabatini F. (2016). GARANTES: un sistema di supporto per una gestione sostenibile degli interventi irrigui e del controllo dei fitoparassiti in aree verdi urbane. Conferenza “Tecnologie e innovazione per una gestione sostenibile dell’agricoltura dell’ambiente e della biodiversità (Ti4AAB), 7-8 luglio 2016, Certosa di Calci (PI), Università di Pisa.
- Carpino C. (2002). Applicazione sperimentale e contestualizzazione di modelli previsionali per la protezione delle colture dai patogeni, ai fini della riduzione di input chimici. Corso di dottorato di ricerca “Scienze e Tecnologie per la Gestione Forestale e Ambientale - XXI Ciclo”, Università degli Studi della Tuscia di Viterbo, pag. 133.
- City of Edinburgh (2014). Trees in the city. Trees & woodlands action plan.
- Collina S., Chiesura A., Brilli S. (2010). Strumenti di pianificazione del verde urbano in Italia. Studio sulle principali città italiane. ISPRA, pag. 238.
- Cooke B., Coffey B. (2016). To green our cities, we must rethink our relationship with nature.
- European Commission (2015). Towards an EU research and innovation policy agenda for nature-based solutions and re-naturing cities. Final Report of the Horizon 2020 expert group on “Nature-Based Solutions and Re-Naturing Cities”. European Commission, Brussels, Belgium.
- FAO (2016). Guidelines on urban and peri-urban forestry, by F. Salbitano, S. Borelli, M. Conigliaro and Y. Chen. FAO Forestry Paper No. 178. Rome, Food and Agriculture Organization of the United Nations, pag.172.
- Forest Research (2010). Benefits of green infrastructure. Report by Forest Research. Forest Research, Farnham
- Forestry Commission England (2010). The case for trees in development and the urban environment. Bristol: Forestry Commission.
- Gelernter, W., Stowell L. (2005). Improved overseeding programs 1. The role of weather. Golf Course Manage. March: 108–113
- Giosuè S., Rossi V., Ponti I., Bugiani R. (2000). Estimating the dinamic of air-borne ascospores of the apple scab pathogen Venturia inaequalis. OEPP/EPPO Bulletin 30: 137-142.
- Goddard M. A., Dougill A.J., Benton T.G. (2010). Scaling up from gardens: biodiversity conservation in urban environments. Trends in Ecology & Evolution 25(2): 90-98.
- Haase D., Larondelle N., Andersson E., Artmann M., Borgström S., Breuste J., Gomez-Baggethun E., Gren Å., Hamstead Z., Hansen R., Kabisch N., Kremer P., Langemeyer J., Rall E.L., McPhearson T., Pauleit S., Qureshi S., Schwarz N., Voigt A., Wurster D., Elmqvist T. (2014). A quantitative review of urban ecosystem service assessments: concepts, models, and implementation. Ambio 43(4): 413-433.
- Kabisch N., Frantzeskaki N., Pauleit S., Naumann S., Davis M., Artmann M., Haase D., Knapp S., Korn H., Stadler J., Zaunberger K., Bonn A. (2016). Nature-based solutions to climate change mitigation and adaptation in urban areas: perspectives on indicators, knowledge gaps, barriers, and opportunities for action. Ecology and Society 21(2): 39.
- Knapp S., Kuehn I., Stolle J., Klotz S. (2010). Changes in the functional composition of a Central European urban flora over three centuries. Perspectives in Plant Ecology Evolution and Systematics 12: 235-244. Johnston M., Percival G. (Eds.). (2012). Trees, people and the built environment (Forestry Commission Research Report). Edinburgh: Forestry Commission, pag.258.
- London Assembly Environment Committee (2007). Chainsaw massacre. A review of London’s street trees. London: Greater London Authority.
- Moffat A. J. (2016). Communicating the benefits of urban trees: A critical review. Arboricultural Journal. The International Journal of Urban Forestry, Volume 38, Issue 2: 64-82.
- Romani M., Rapi B., Battista P., Mati F., Bacci L. (2012). Nuove tecnologie per il monitoraggio e la gestione dei giardini storici. SCIRES-IT, Vol 2, Issue 1: 105-120.
- Rossi V., Ponti I., Marinelli M., Giosuè S., Bugiani R. (2001). Environmental factors influencing the dispersal of Venturia inaequalis ascospores in the orchard air. Journal of Phytopathology 149: 11-19.
- Seto K.C., Güneralp B., Hutyrac L.R. (2012). Global forecasts of urban expansion to 2030 and direct impacts on biodiversity and carbon pools. Proceedings of the National Academy of Sciences of the United States of America. Edited by B. L. Turner, Arizona State University, Tempe, AZ.
- Wilson L.T., Barnett W.W. (1983). Degree-Days: An Aid in Crop and Pest Management. California Agriculture. 37: 4-7.
- Zalom F.G., P.B. Goodell, L.T. Wilson, W.W. Barnett, and W.J. Bentley. 1983. Degree-Days: The Calculation and Use of Heat Units in Pest Management. University of California, Division of Agriculture and Natural Resources Leaflet 21373, pag. 10.