")
")
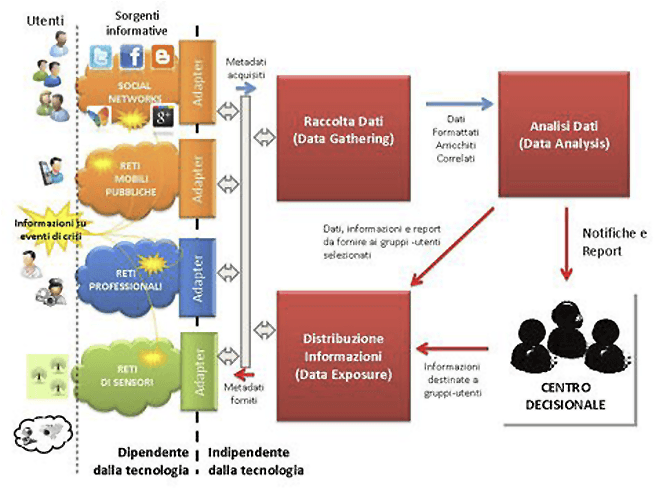
The WiLife project (WireLess and ICT technologies for an efficient and integrated system for the prevention and management of crisis and emergency situations), funded by the Tuscany Region as part of the POR CReO FESR 2007-2013 program (Line 1.5.a - 1.6 ; call for R&D 2012), coordinated by Selex ES SpA (now Leonardo Company), had the objective of proposing and developing innovative tools for emergency management, capable of effectively combining new operational requests with technological developments in the ICT sector. Modern emergency management methodologies make it essential to have specific context information, typically multimedia, to better organize, coordinate and implement intervention and rescue operations. To respond effectively to these needs, new generation professional networks must evolve by acquiring the typical characterization of pervasive, secure, and reliable broadband networks. It is in this context that the WiLIFE project is placed, the aim of which was to create a functional integration model between professional communication networks newly developed, specific sensor networks (classic and WSN) and Social Network tools, so as to encourage the exchange of information with citizens in a pervasive and ubiquitous form.

The Research and Development of a problem-solving model to be part of a community, applied in the context of emergency scenarios, representing the innovative factor that allows to evolve the classic decision support systems based on sensor networks and operators on territory towards intelligent systems that integrate technologies and which are able at the same time to analyze and interpret the perception of Operators and Citizens on the territory. The social networks represent the innovative tool to deal with emergency situations in which citizens act as real "sensors" capable of sending reports, photos, and videos. In crisis contexts the most used social networks are Facebook and Twitter. When a natural disaster occurs when information comes from sensor networks, public safety operators (TETRA) and users of Twitter are correlated and shown on control panels with the help of geographic maps by providing reports that operators in the crisis room use to organize rescue operations.
With around 2000 flood events recorded between 2002 and 2014, the loss of 293 human lives and significant damage to populations, production and infrastructure, the hydrogeological risk represents one of the most serious emergencies for our country. In Italy, in fact, 1,260,000 buildings are considered exposed to hydrogeological risk, of which 6,251 are school buildings and 547 hospitals; practically half of the population lives in medium or high-risk areas (http://www.anbi.it/). Among the different regions, the Tuscan regional territory is among the most exposed and its safety, as well as the control of risk conditions and environmental monitoring, must be considered an essential programmatic commitment of each government. In the "2014 plan for the reduction of hydrogeological risk", the ANBI estimates in 1.2 billion euros the amount necessary for the adaptation of the remediation works in Tuscany.
For this reason, within the WiLIFE project, we have chosen to give priority to this type of problem, studying a system for collecting, integrating and processing meteorological-hydrological data from mixed networks (public and private), capable of processing the environmental information required for real-time assessment of the level of hydrogeological risk.
Some of the procedures adopted for the integration of environmental data and implemented within the components called EDMS (Environmental Data Management System) are presented below, to allow verification of the functionality and efficiency of the WiLIFE demonstrator (Battista et al. , 2014 b). The operating scenario chosen is that corresponding to an exceptional weather-hydrological event, which occurred in 2011 with return times (Tr = 24 h) greater than 100 years (AA.VV., 2011), in the Alto Magra basin, one of the most exposed basins of the Tuscany Region. In the case of localized and intense events such as the one in question, the time that elapses between the onset of the rain and the onset of the flood of the watercourse can be truly short. In this context, therefore, forecasting and prevention activities acquire strategic importance, provided they are based on reliable data and tools. The study, therefore, set itself the objective of developing a methodology that would allow the available data to be used efficiently and at the same time allow to support preliminary technical-scientific assessments on the dynamics underway in complex orography and real monitoring needs.
The EDMS system consists of several software modules that operate under the Windows operating system (Battista et al., 2014 b). Among the most important are those developed for the preparation of information plans and cartographic restitution, implemented in the ESRI ArcGIS™ environment, and those for geostatistical and modeling analysis, implemented in the MATLAB™ environment. The procedures followed, for the moment, remain manual for the components made in the ArcGIS environment, while they have been automated for the modules implemented in MATLAB™. Being a prototype and demonstration system, as far as possible, the different components have been integrated keeping the native software language.
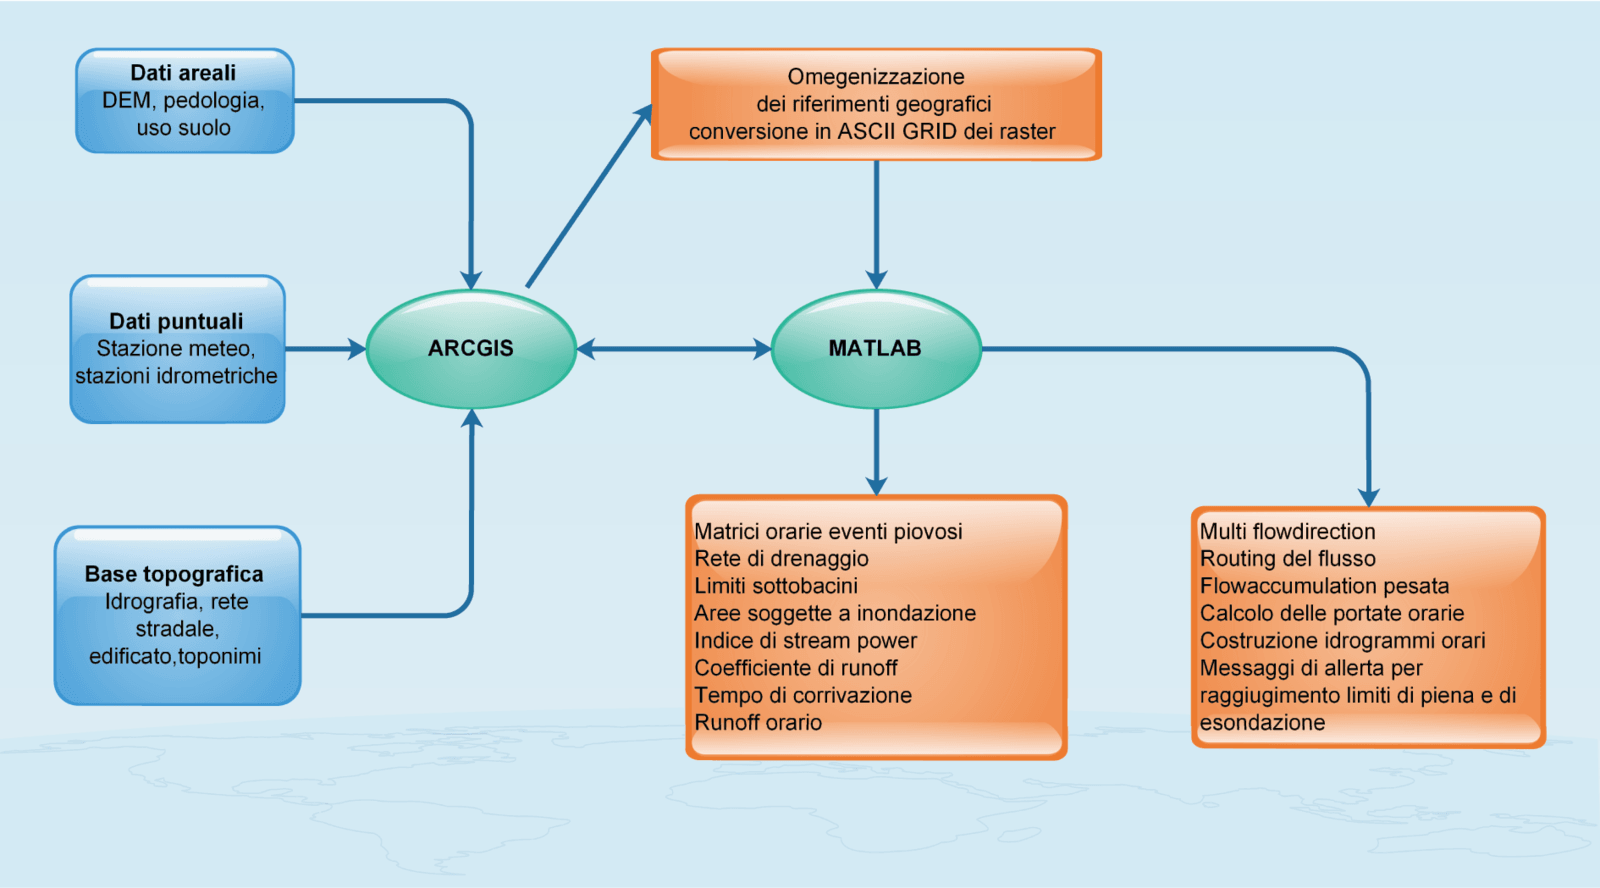
Block diagram of the EDMS system, developed within the WiLIFE project.
The basic geographical information such as: area themes (soils, land use, etc.), specific topics (weather and hydrological stations), the topographical base, are elaborated in ArcGIS and transformed into MATLAB compatible formats. In MATLAB the information is used to build all the expected outputs
The analysis procedure uses some of the standard modules, for the creation of basic thematic layers, and specific functions, for the reproduction of the weather-hydrological event.
To facilitate the understanding of the outputs and allow a verification of the functionality and efficiency of the WiLIFE demonstrator, some of the procedures used for their realization are briefly described below.
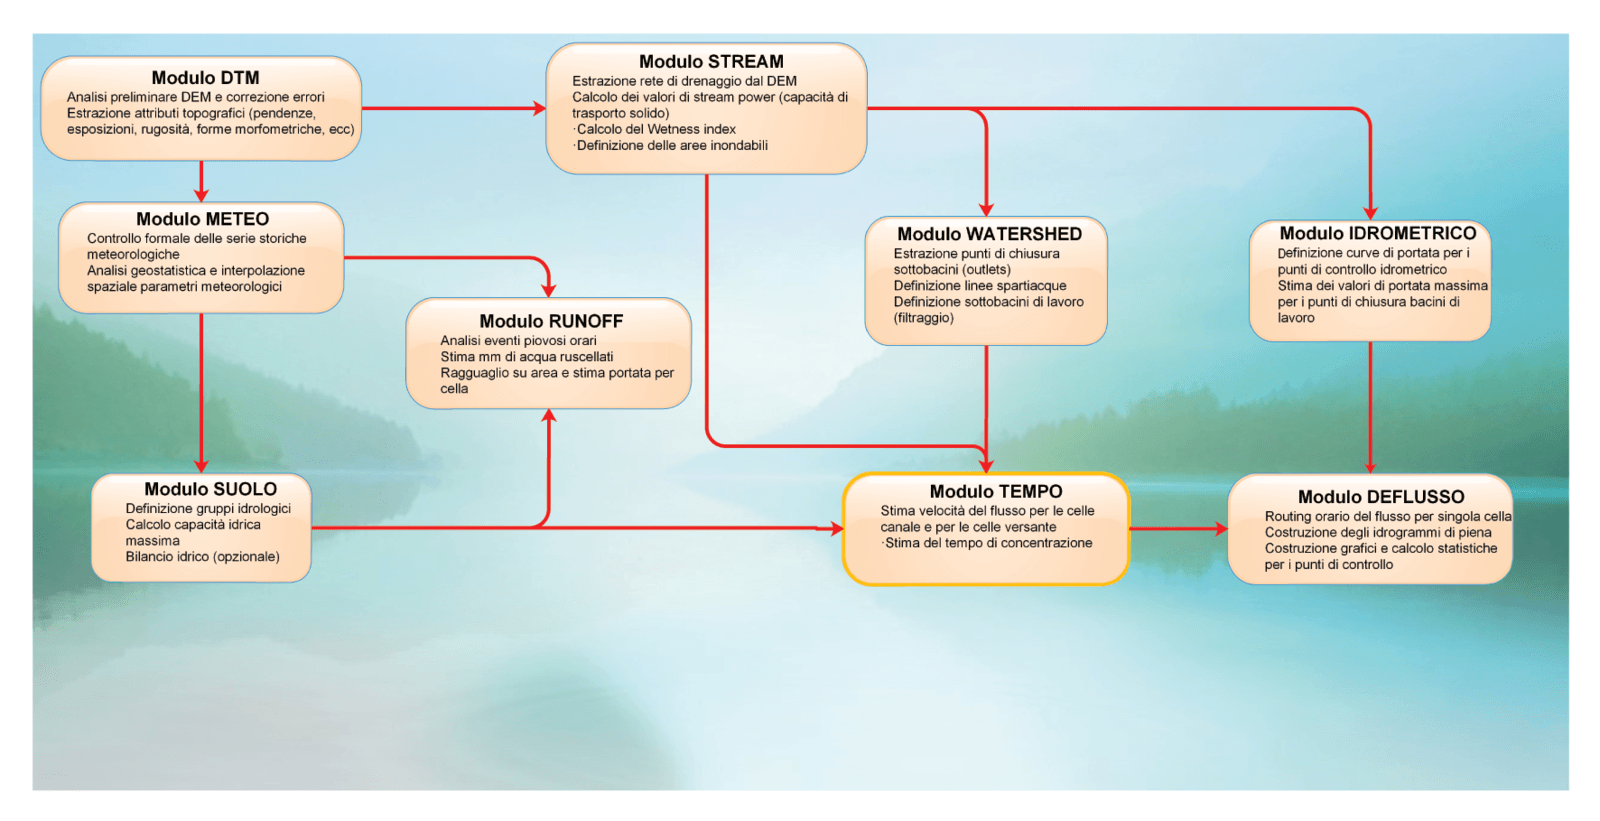
Flow chart of the Environmental Data Analysis System at the basin scale.
The figure shows the logical interconnections between the various modules of the system and how the system adopts the technique of the cascade models
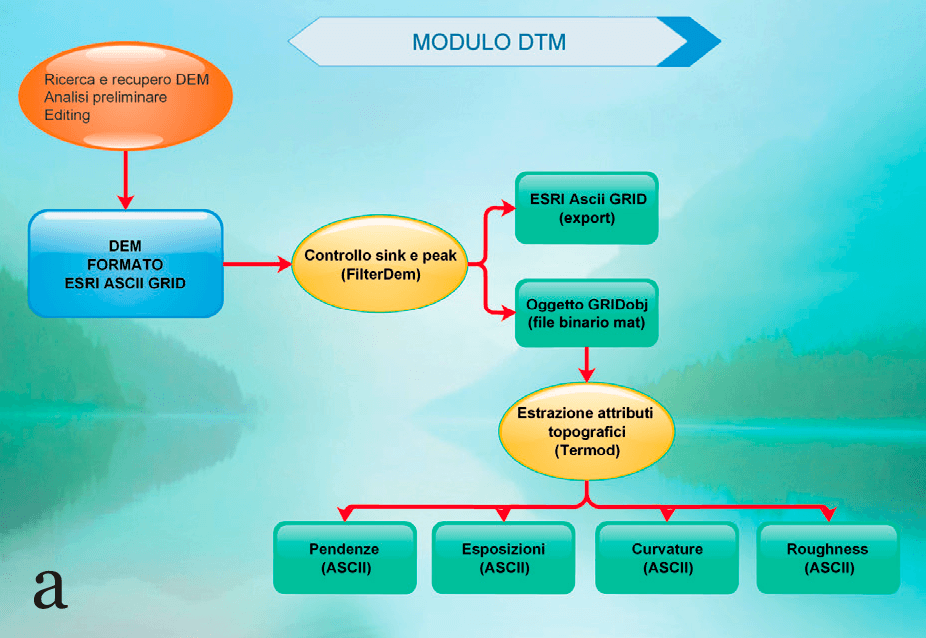
DTM Module
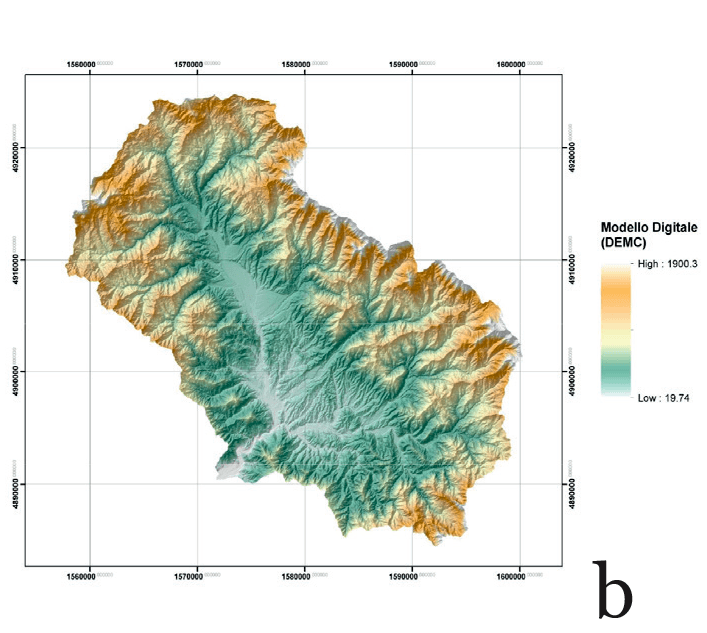
Starting from the Digital Terrain Model of the Tuscany Region, clipped on the Magra watershed limit, the DTM curvature was extracted, highlighting errors and misalignments that could be an obstacle to the application of any hydrological model. For further refinement, LIDAR 2010-2012 images (1x1 m resolution) were used. This allowed to create a new correct DEM (10 x 10 m), validated for the study of hydrological flows, on which a filter function was applied (Tarboton et al., 1991), to verify the flow continuity. The DTM module (Fig. a) therefore allows to obtain a digital terrain model hydrologically correct terrain (Fig. b) and provides a series of tools for the geomorphological characterization of the study area. The individual outputs can be used to produce cartography or as inputs for other modules of the system or external models.
The morphometric analysis of the digital terrain model consists in the extraction of the main physical and morphological information implicit in the model, taken as the best possible representation of the reality of the area of interest. The topographical attributes that can be extracted are:
- Slope: corresponds to the maximum height variation between a cell to evaluate and the eight neighboring cells; represents the first derivative of the surface defined by the DEM.
- Aspect: corresponds to the direction of the surface normal, considered by some authors (Gómez-Plaza et 2001), more representative of the water content of the soils, given its high correlation with the maximum insolation of the slope. The aspect is expressed in degrees (0-360 °, from the north in a clockwise direction).
- Curvature (Planform curvature, Profile curvature, tangential curvature) :represents the second derivative of the surface defined by the DEM. The curvature of a surface with respect to a point is the curvature of a line formed by the intersection of the surface with a plane passing through the point, with a specific orientation (Olaya V., 2009). The curvature value is the reciprocal of the radius of curvature and is expressed in radians. It is calculated both for the horizontal plane that passes through a specific cell (Planform curvature), and for the surface in the direction of maximum slope (Profile curvature), in order to obtain indications on the speed of water flow.
- Topographic heterogeneity indices (Roughnees, Topographic Ruggedness Index, Surface roughness factor): statistical indices applied on 3x3 cell windows, used for proximity analysis on the elements of the Digital Terrain Model. These indices are useful for understanding the morphological characteristics of the study area and assessing their discontinuity: Roughnees, maximum difference in altitude between one cell and the 8 neighboring cells (Hobson, 1972); Topographic Ruggedness Index, the difference between the adjacent cells of a DEM, corresponding to the standard deviation within a 3x3 cell window (Riley, 1999).
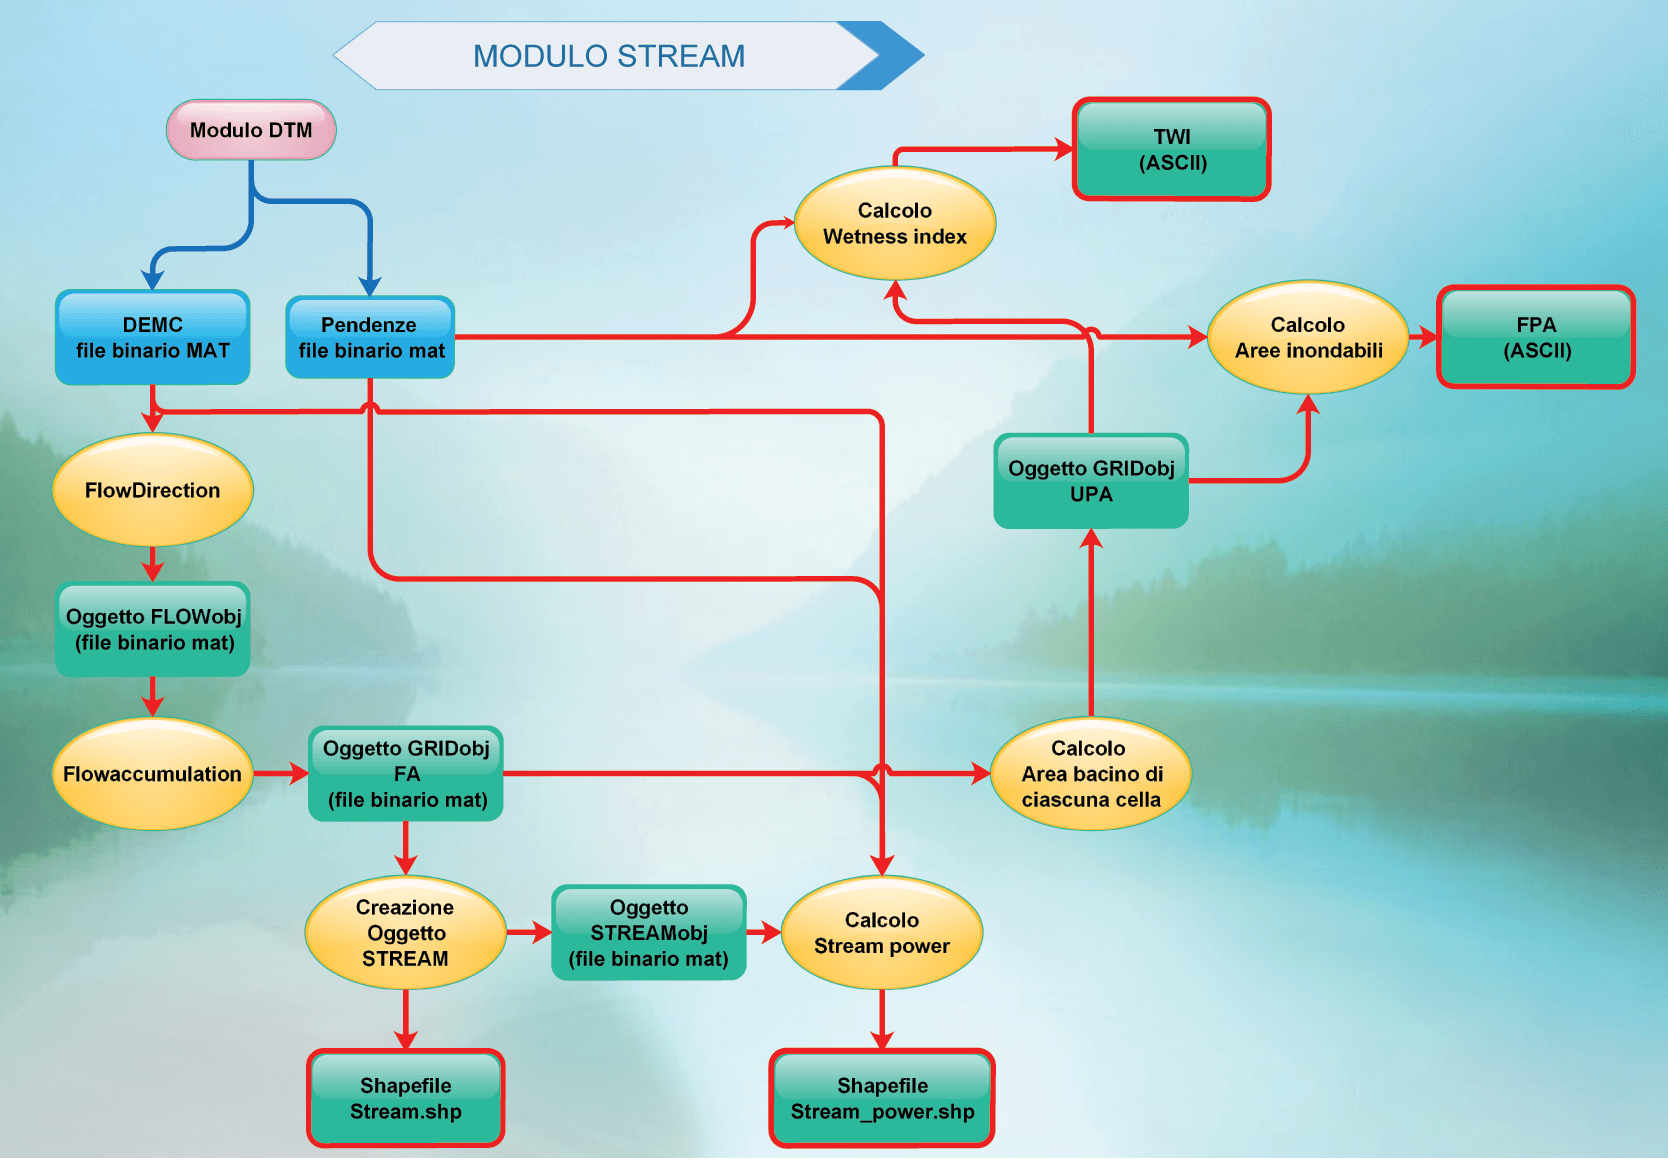
Stream Module
The module allows the distribution of the runoff water in the underlying cells on the basis of slope and orientation criteria, also indicating the direction taken at each point. The module also allows you to define the hydrographic network and the profile of the river channels, in addition to the extraction of the flood areas.
The most important analytical components are:
Flow Direction - determines the prevailing direction of the flow of water and sediment carried over the surface of the soil. To take lateral flow into consideration, the total amount of water is divided as a percentage between the receiving cells based on the relative gradients (Quinn et al, 1991; Arge et al., 2001; Coultard et al, 2002).
Flow accumulation - calculates the number of cells that pour their water on a given point, producing an estimate of the drainage area and the consequent quantity of water present in each cell following a rainy event.
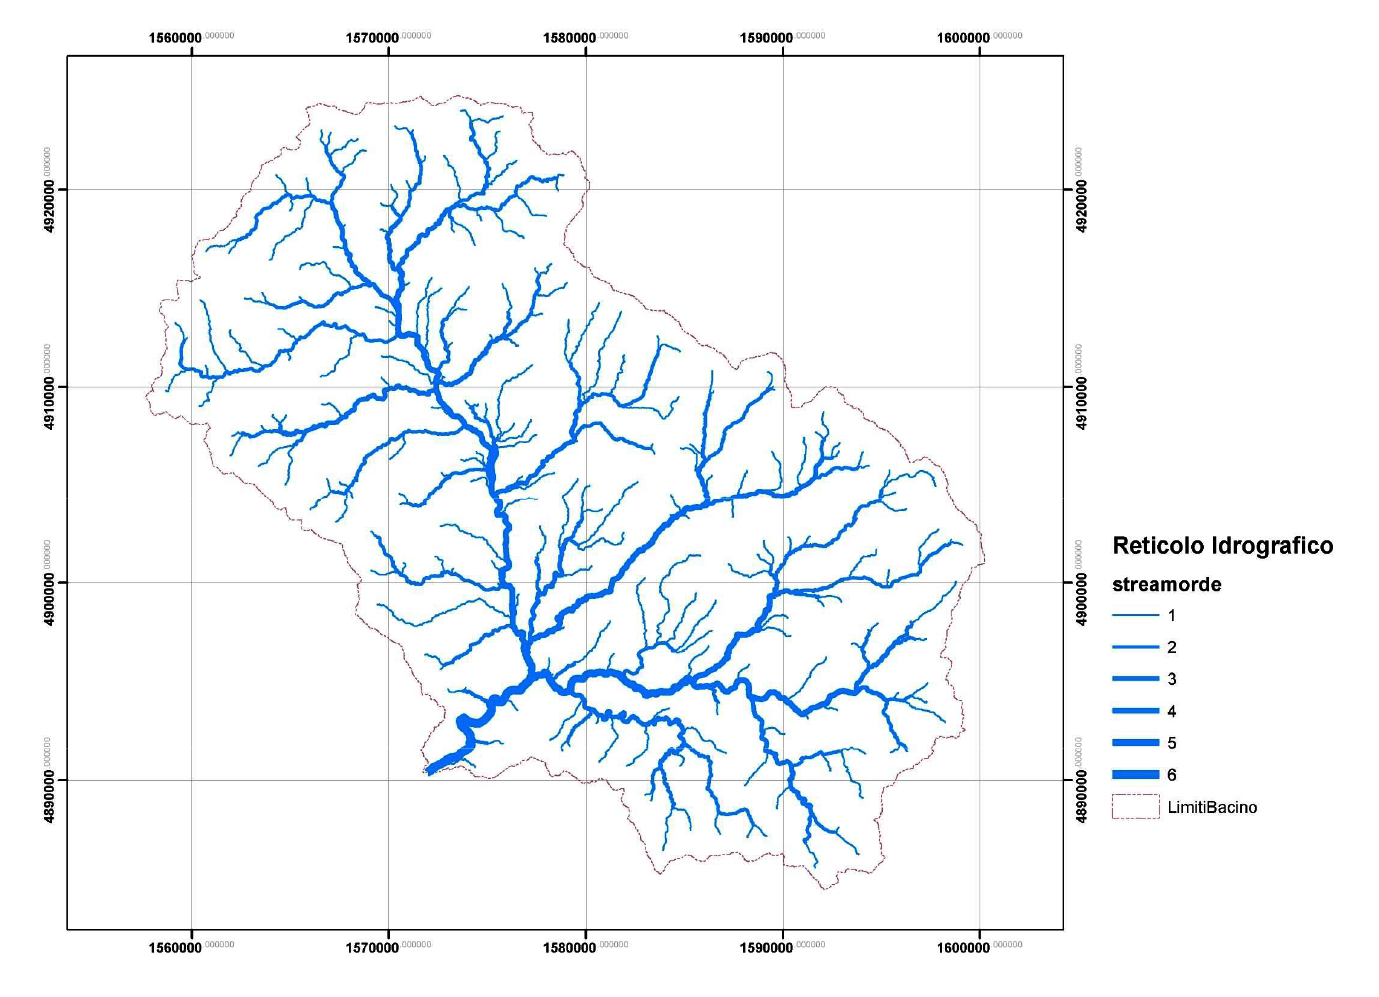
Extraction of the drainage network - the extraction of the drainage network is obtained by applying "reversing surface" thresholds, where each arch of the "shapefile" represents a portion of the channel network, connected to a record of attributes also containing the class of elements according to the Horton-Strahler method (AA. VV, 2006).
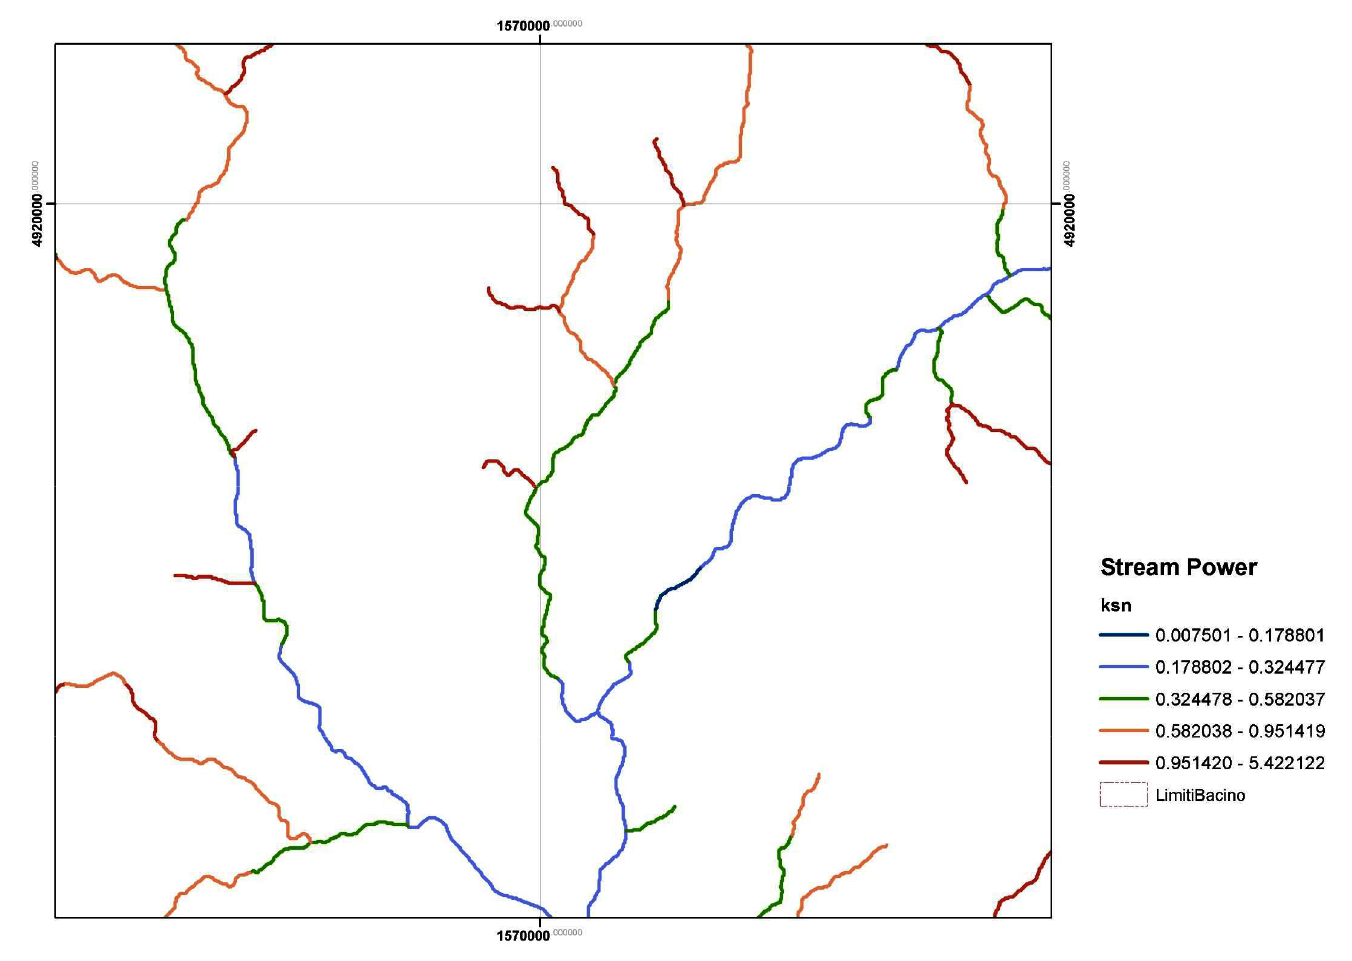
Stream power - allows the calculation of the kinetic power of each portion of the outflow network, in relation to the slope and characteristics of the channel.
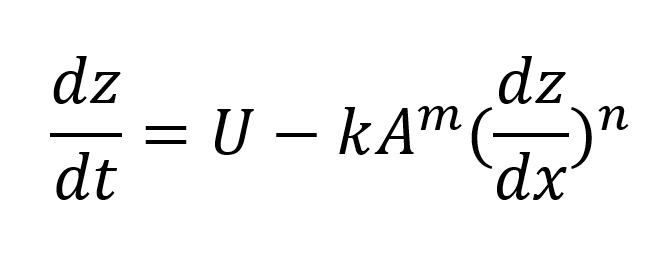
Where
U is the velocity of the solid material; A is the area of the basin that drains into the cell; dz / dx is the slope; k and m are coefficients.
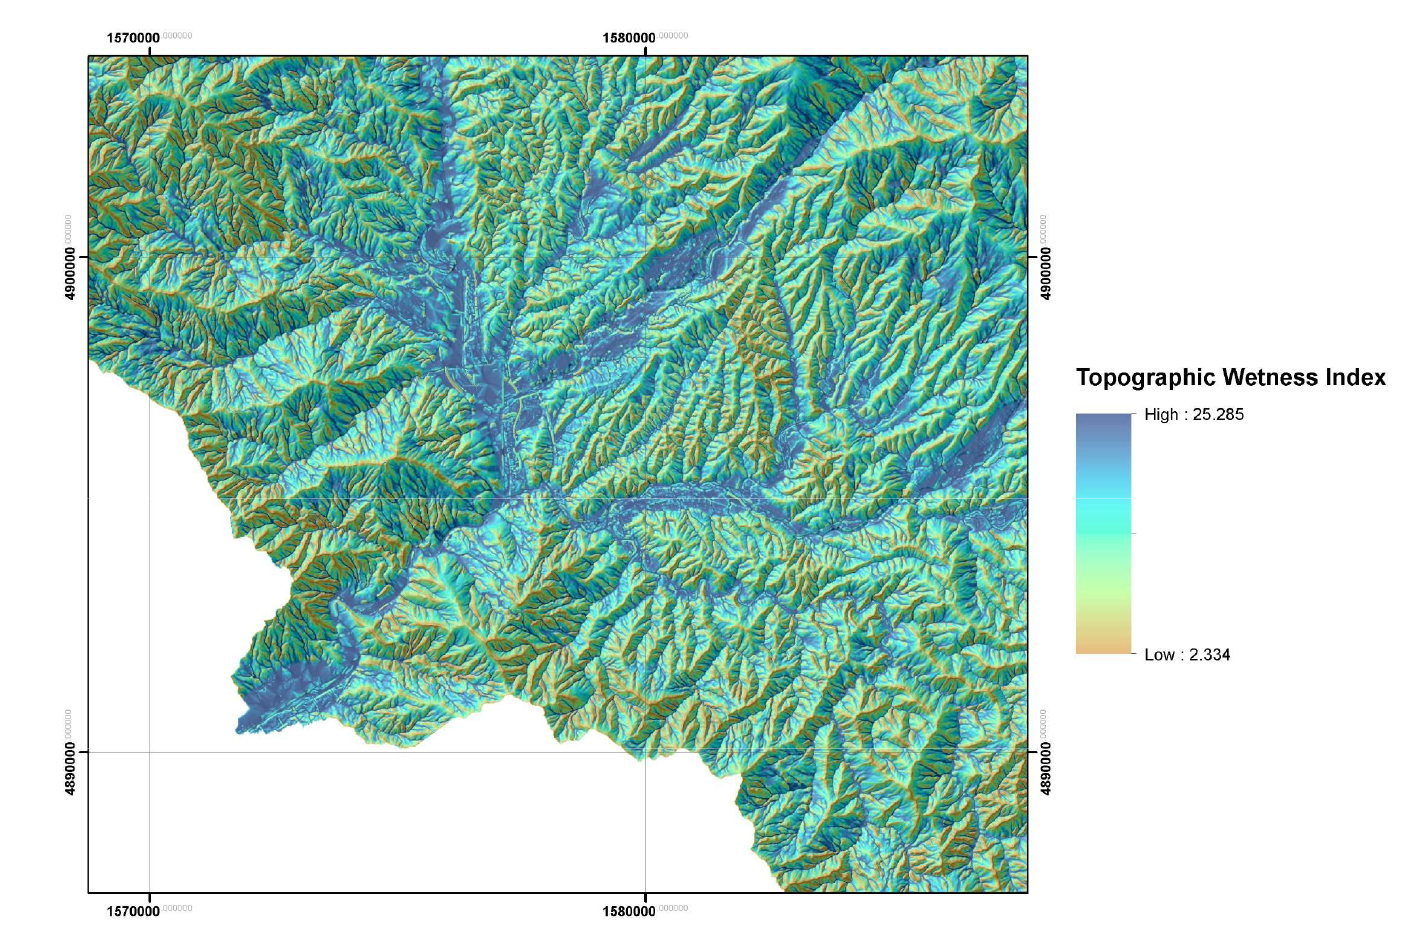
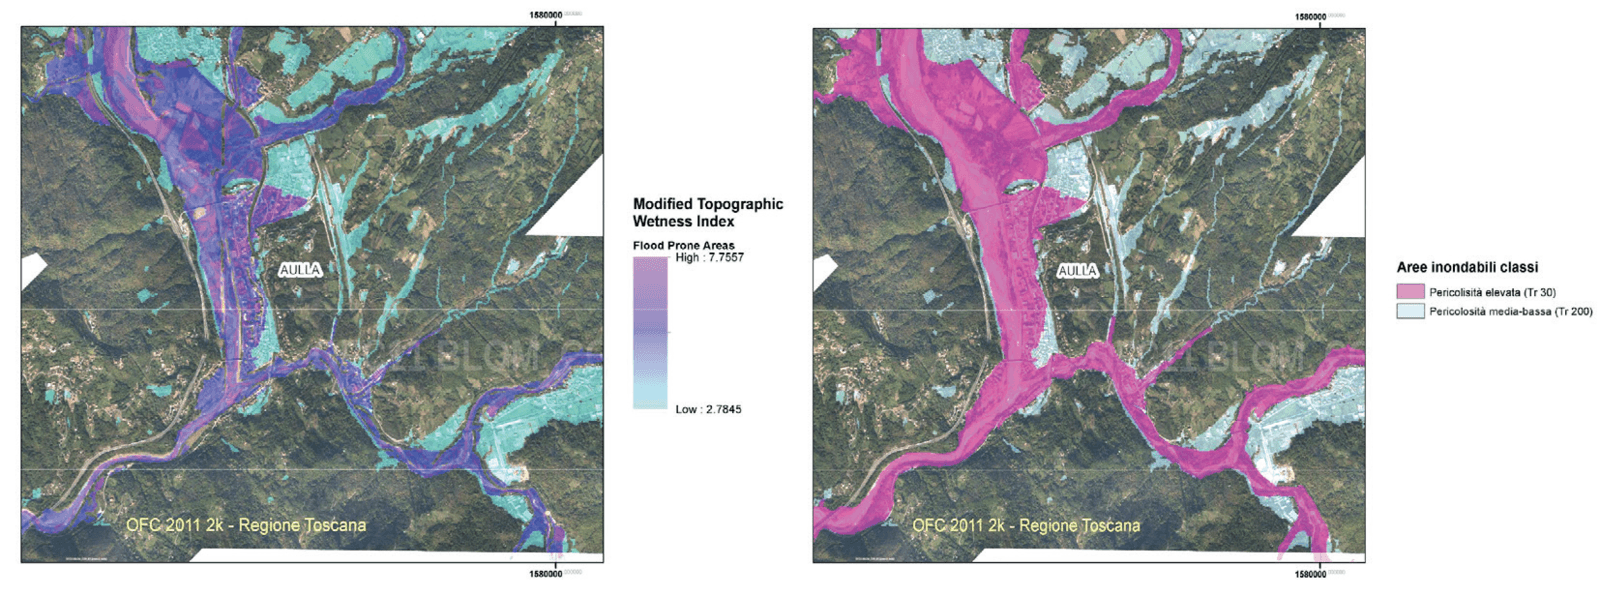
Topographic Wetness Index (TWI) - defines the tendency of water to concentrate in areas with low slopes, close to the hydrologic network, providing indications on flood risks (Beven and Kirkby 1979; Western et al., 2004):
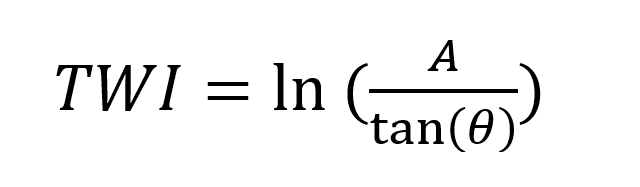
where
tan (θ) is the tangent to the slope angle;
![]() is the area of basin of each cell for linear meter;
is the area of basin of each cell for linear meter;
b = cell size (resolution) and ![]() is the upstreamm area for each cell
is the upstreamm area for each cell
Floodplain - identifies potentially flood areas, using the r.hazard.flood module (Manfreda et al., 2011; Di Leo et al., 2011) of GIS-GRASS. This method differs from the previous TWI index seen, only for the application of an exponent n, depending on the size of the cell, to the area A:
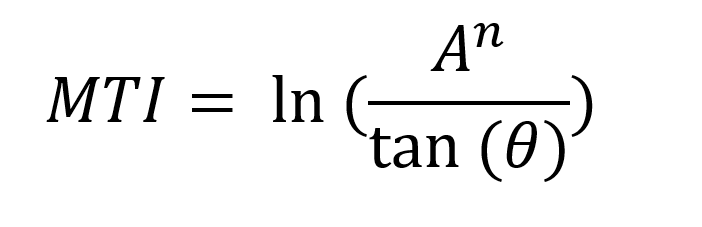
With n = 0.016 (cell-size 0.46)
Cells with an MTI index value greater than a predefined threshold are identified as floodable. Currently the threshold is determined by the following equation:
mti_th=10.89 * n + 2.282
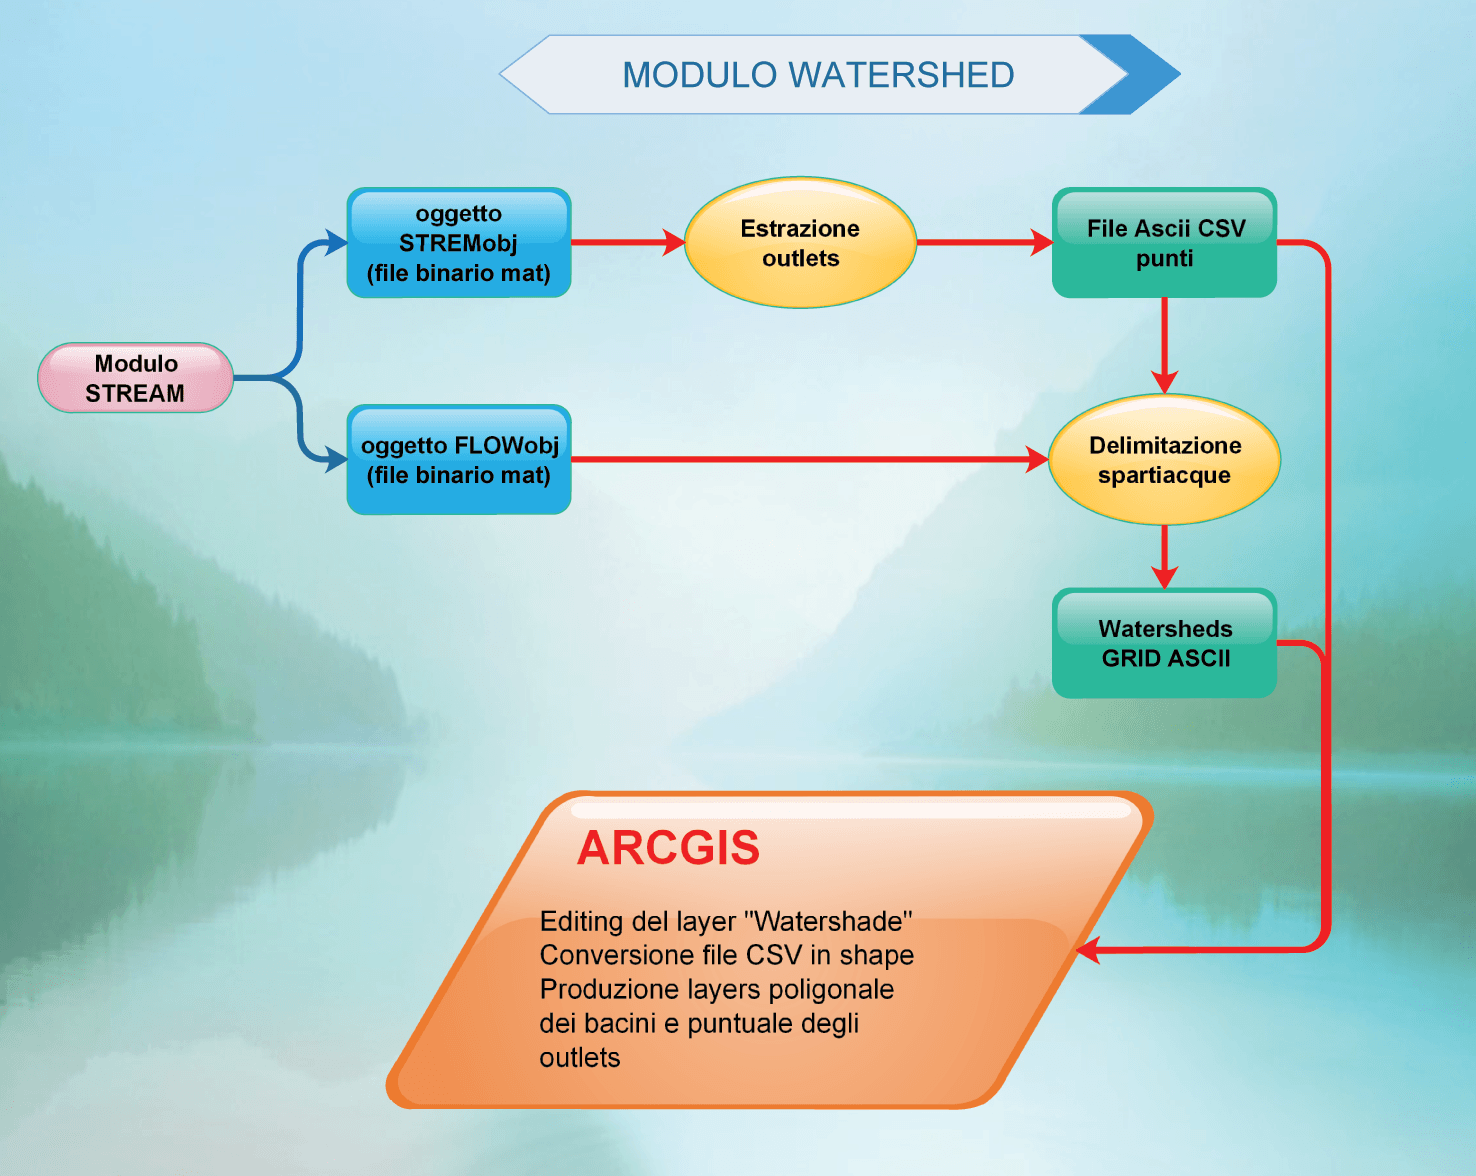
Watershed module
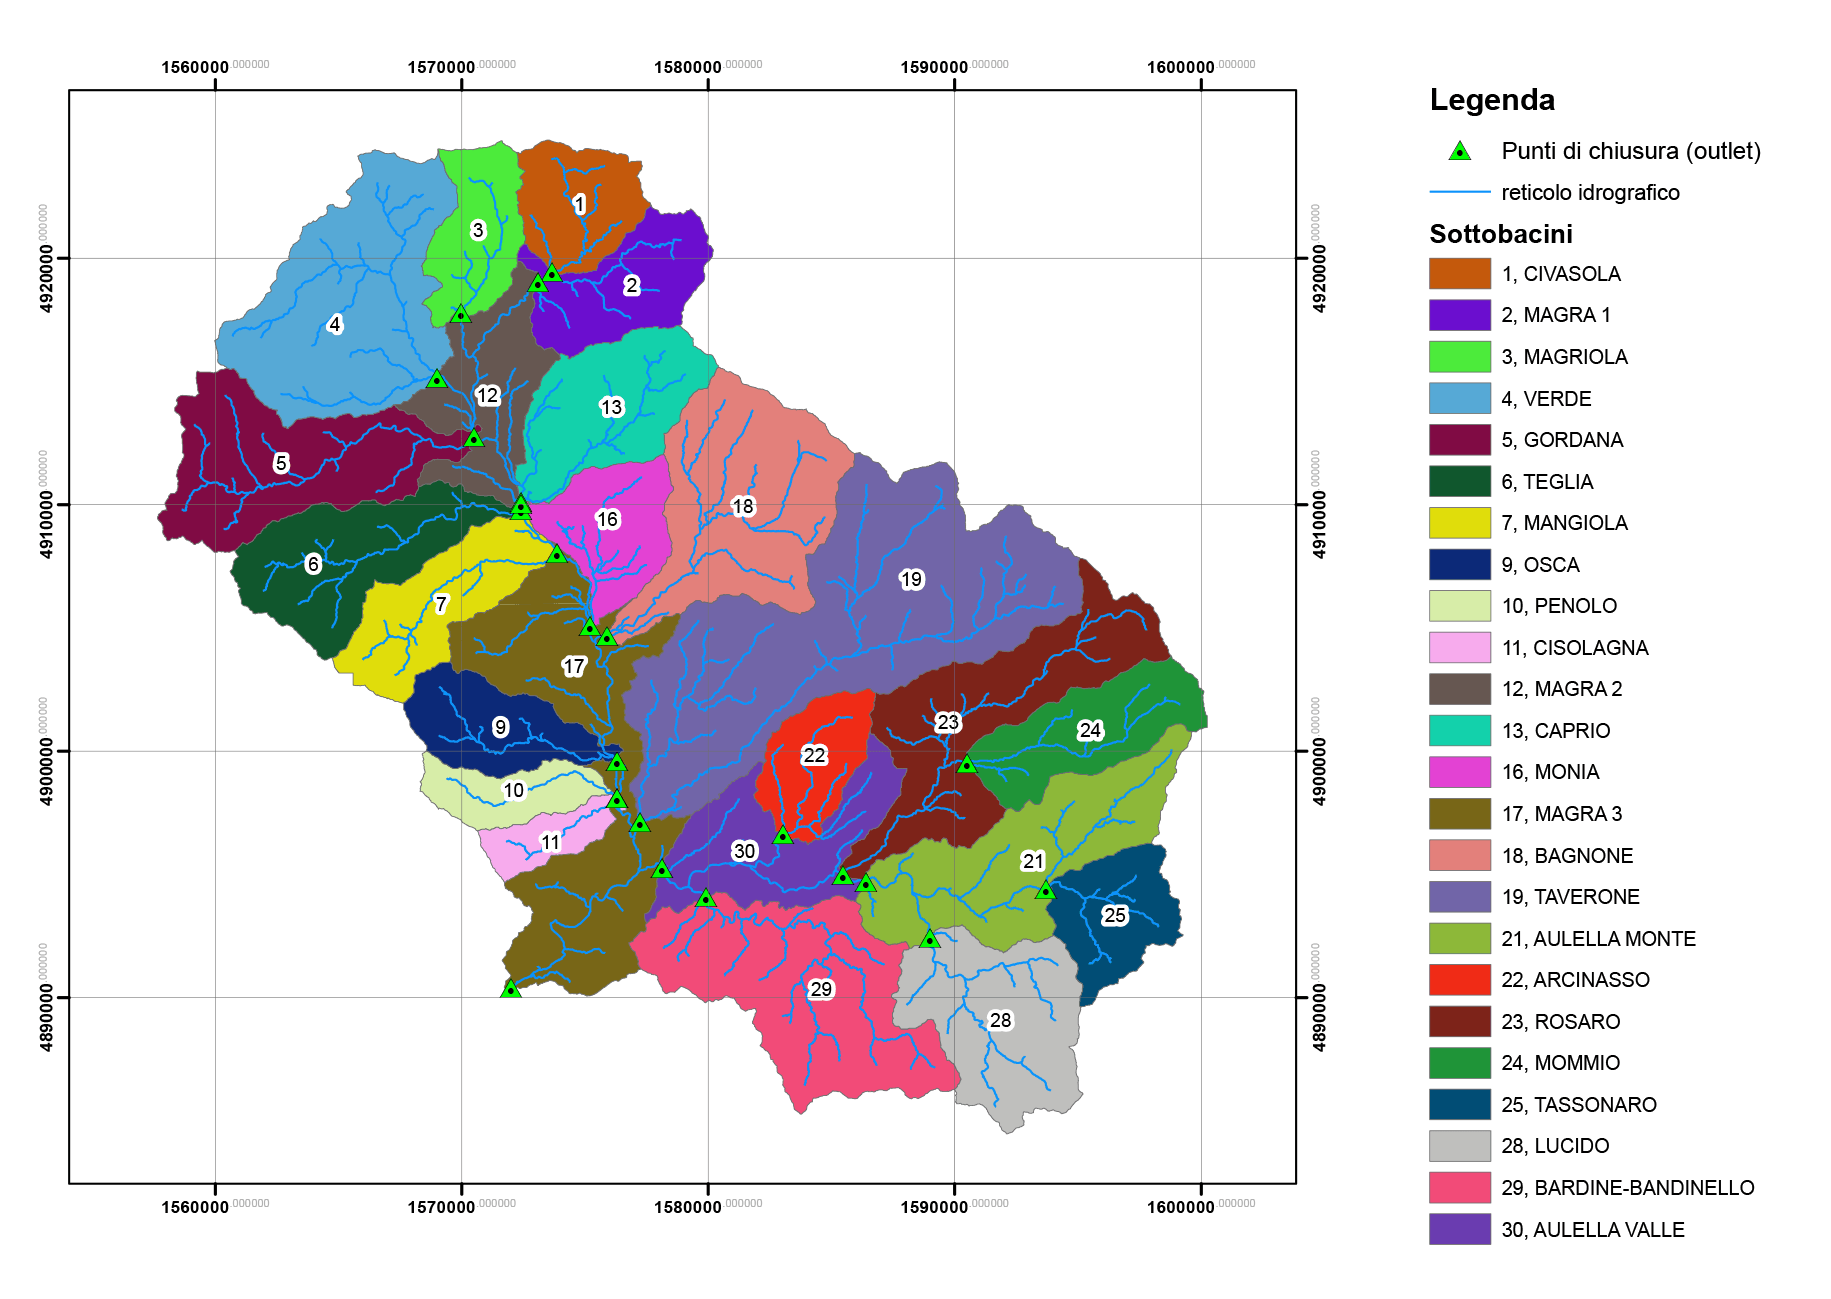
The module, partially automated, allows to define, according to the hydrographic network and the flow lines, the closing points (outlet or pour point) and the limits of the main sub-basins useful for the subsequent analysis of the surface runoff . The extracted basins are then filtered by size using ArcGIS editing tools in order to obtain the map of the definitive sub-basins and the shape of the related outlets
Introducing
IMAGE LAYOUTS ADDON
Watershed module flow chart. The first part of the elaboration has been performed in MATLAB using the Topotoolbox by Wolfgang Schwanghart, geomorphologist at the University of Potsdam.
TopoToolbox is a MATLAB program for the analysis of digital elevation models (DEMs). It's free and open source (as long as you have MATLAB).
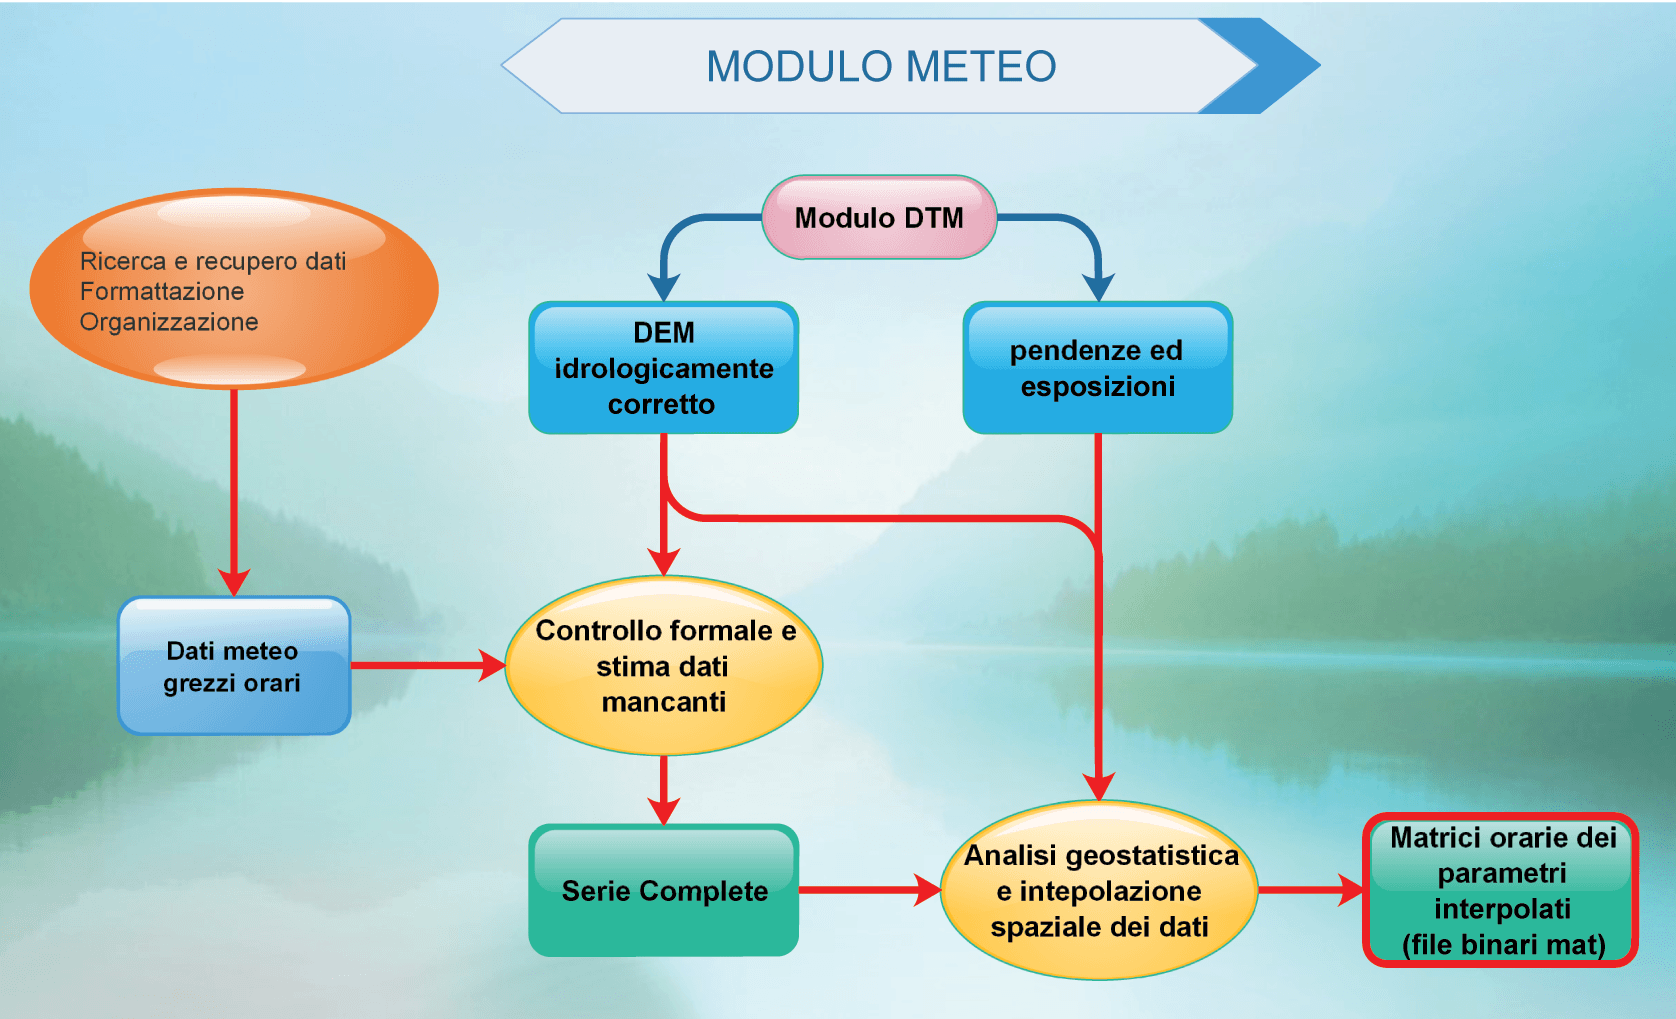
Weather module
The Weather module, based on the data of the stations active in the area, performs the the hourly data interpolation, using information relating to the position of the rain gauges and the geomorphological characteristics extracted from the DEM, in order to determine the rain matrices of the basin under examination, with a resolution of 10 x 10 m.
The raw data collected is subjected to a validation analysis. The validation procedure is structured in levels that indicate the different degree of confidence in the data:
- Congruency temporal and internal: Identification of values out of range or inconsistent
- Formal control: Identification of values defined as "impossible" and missing.
Values identified as anomalous are assigned a flag and are considered as missing data. The missing data are therefore estimated using a spatialization technique, based on a 3D interpolating surface built from the data considered valid of the meteorological stations present in the territory. The interpolating surface is constructed using the “scatteredInterpolant” function which uses the Delaunay triangulation method (George et al., 1998) on a three-dimensional plane.
Case study: Reconstruction of the meteo-hydrological event of 25 October 2011
For the assessment of the reliability of the procedures implemented in the EDMS system, the real data collected during the dramatic event recorded in the Magra river basin in October 2011 was used, which caused the death of 12 people and caused significant damage in many municipalities in the area . For the reconstruction of the meteo-hydrological trend, the hourly data of the Agrometeo-Climatic Data network (ex ARSIA data) and of the Hydrographic Service network of the Tuscany Region (22 meteorological stations and 6 hydrological stations) were used, in order to be able to reconstruct in a more realistic way the ground conditions existing in the critical hours.
In consideration of the morphology of the Magra basin, the spatialization of the rainfall data was carried out, applying a spline regularized with tension (Mitasova et al., 1993), which allowed to obtain good estimates of rainfall on the ground throughout the duration of the event. The spatial scale used for information plans and simulations was that of the correct DEM (10x10 m), obtained in the DTM module starting from the digital terrain model of the Tuscany Region.
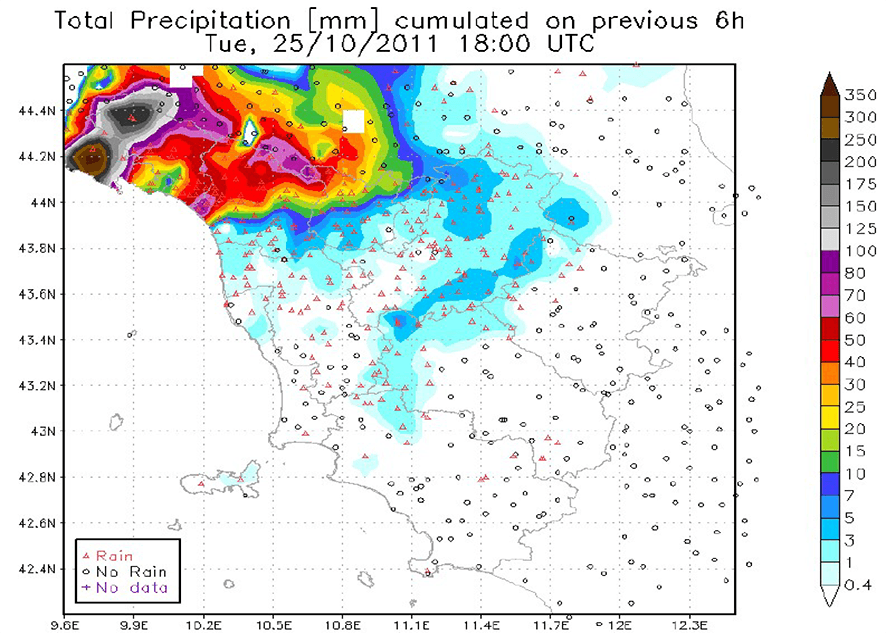
In the first 6 hours of the night (figure 10) on October 25th there are already some heavy rains on the Lunigiana and on the Ligurian Levant and the first thunderstorms. Maximum cumulative points between 30 and 40 mm. In the following 6 hours, the rains intensify further in these areas and storm activity intensifies significantly. Maximum points of 220-230 mm (of which 180 mm between 9 UTC and 12 UTC) on the Ligurian east and up to 120 mm in Lunigiana (of which 100 mm between 9 UTC and 12 UTC).